AllĆØgre Rainfall & Precipitation: Monthly Averages and Year-Round Insights
This page shows the average amount of rainfall per month in AllĆØgre. The numbers are calculated over a 30-year period to provide a reliable average. Now, letā€™s break down all the details for a clearer picture.
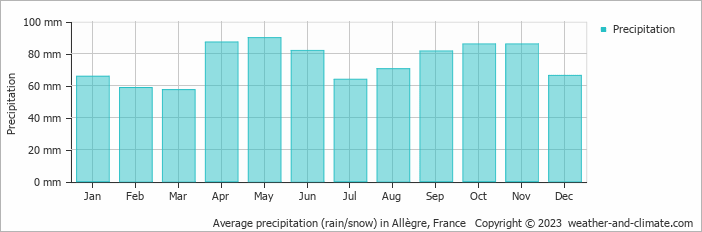
Generally, AllĆØgre experiences moderate precipitation patterns, averaging 894 mm yearly.
Monthly Precipitation Levels
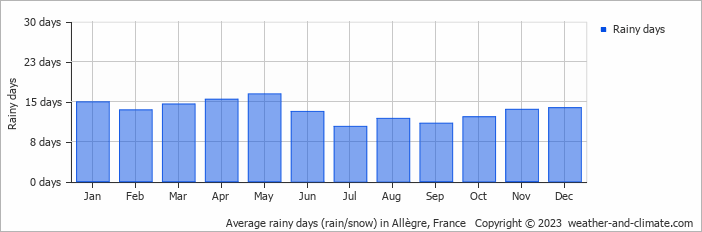
The average number of days each month with precipitation (> 0.2 mm)
May, the cityā€™s wettest month, has a maximum daytime temperature of 19Ā°C and receives 215 hours of sunshine. During the driest month March you can expect a temperature of 12Ā°C. For more detailed insights into the cityā€™s temperatures, visit our AllĆØgre Temperature page.
Annual Precipitation in France
The map below shows the annual precipitation across France. You can also select the different months in case you are interested in a specific month.
 heavy rainfall
 high
high
 moderate
 low
low
 almost none
Amsterdam Precipitation Compared World Wide
AllĆØgreā€™s average annual precipitation is 894 mm. Letā€™s compare this to some popular worldwide tourist destinations:New York City, USA, receives 1276 mm of rainfall annually, with precipitation evenly distributed throughout the year.
Meanwhile, Buenos Aires, Argentina, enjoys a humid subtropical climate with 1000 mm of annual rainfall, mostly in the summer.
Adelaide, Australia, enjoys 511 mm of annual precipitation, with dry summers and wet winters.
Ho Chi Minh City, Vietnam, receives 1955 mm of annual rainfall, with a pronounced wet season from May to November, typical of its tropical monsoon climate.
How is Precipitation Measured?
Precipitation amounts are measured using specific gauges installed at weather stations, collecting both rain and snow and any other type of precipitation. Rainfall is measured directly in millimeters, while that from snow and ice is obtained by melting it. Automated systems often incorporate heaters to make this easier.
Information from these stations is transmitted via Wi-Fi, satellite, GPS, or telephone connections to central monitoring networks. This information is immediately updated and integrated into weather models and forecasts.
Sea vs. Land Precipitation
The proximity of a location to a large body of water can significantly affect its rainfall patterns:
- Ocean Influence: Coastal regions typically receive more rainfall due to the presence of moisture-laden winds from the ocean. These regions tend to have more humid climates and experience more frequent precipitation, especially in winter.
- Continental Climates: Areas further from the sea, such as inland or continental regions, experience less frequent rainfall and more extreme seasonal variations in precipitation.
For more detailed information about AllĆØgreā€™s weather, including sunshine hours, humidity levels, and temperature data, visit our AllĆØgre Climate page.
Current rainfall in AllĆØgre
 2 m/s
2 m/spartly cloudy and no rain
1 m/salmost clear and no rain
1 m/sclear and no rain