Porto Monthly Rainfall & Precipitation
This page shows both the average monthly rainfall and the number of rainy days in Porto, Norte Region, Portugal. The figures are based on a 30-year period (1990–2020) to provide a reliable average. Let's explore the details to provide you with a complete overview.
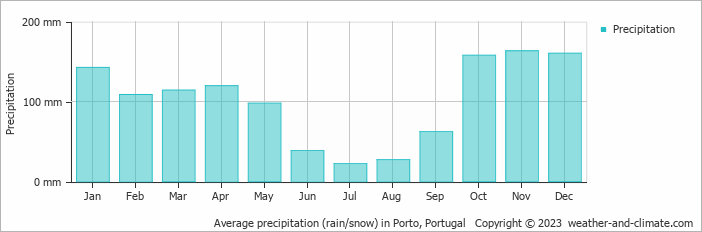
Porto has a notably wet climate with abundant precipitation, recording 1213 mm (48 in) of rainfall per year. It does, however, have a distinct dry season during certain months. Have a look at our detailed charts below to see how precipitation varies throughout the year.
Monthly Rainfall & Rainy Days
Monthly Precipitation Levels
The average number of days each month with precipitation (> 0.2 mm (0.01 in))
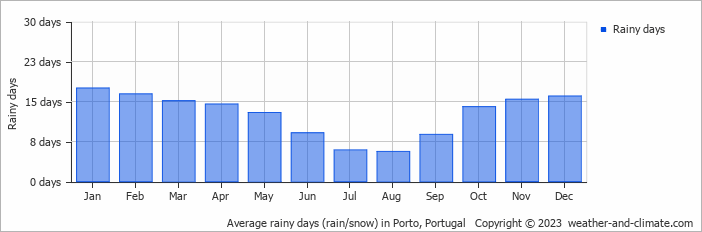
The seasons in Porto, bring significant changes in precipitation. The wettest month, November, receives heavy rainfall, with an average of 163 mm (6.4 in) of precipitation. This rainfall is distributed across 15 rainy days.
In contrast, the driest month, July, experiences much less rainfall, totaling 22 mm (0.9 in) over 6 rainy days. These distinct seasonal differences provide diverse experiences throughout the year.November, the wettest month, has a maximum daytime temperature of 17°C (63°F). The city receives 138 hours of sunshine in this period. During the driest month July you can expect a temperature of 25°C (77°F). For more detailed insights into the city's temperatures, visit our Porto Temperature page.
Daily Historical Precipitation
Average daily rainfall for each day of the month based on long-term records. 50-year average (1976-2025)
Average precipitation in August
Explore Porto's Historical Precipitation: 1976-2026
Browse day-by-day precipitation records for Porto spanning 51 years. Select any month and year to see actual rainfall and snowfall recorded on each day.
Annual Rainfall in Portugal: City Comparison
The map below shows the annual precipitation across Portugal. You can also select the different months in case you are interested in a specific month.
Porto vs World: Rainfall Compared
Porto's average annual precipitation is 1213 mm (48 in). Let's compare this to some popular worldwide tourist destinations:
Chicago, USA, sees an annual precipitation of 1062 mm (42 in), with rain and snow contributing to its humid climate.
Meanwhile, Buenos Aires, Argentina, enjoys a humid subtropical climate with 1000 mm (39 in) of annual rainfall, mostly in the summer.
Perth, Australia, receives 565 mm (22 in) of rainfall annually, mostly during the winter months.
Singapore, situated near the equator, gets 2581 mm (102 in) of rainfall annually, with no distinct dry season and consistent monthly precipitation.
Precipitation amounts are measured using specific gauges installed at weather stations, collecting both rain and snow and any other type of precipitation. Rainfall is measured directly in millimeters, while that from snow and ice is obtained by melting it. Automated systems often incorporate heaters to make this easier.
Information from these stations is transmitted via Wi-Fi, satellite, GPS, or telephone connections to central monitoring networks. This information is immediately updated and integrated into weather models and forecasts.
- Mawsynram in India is noted as being the wettest place on earth, with over 11 meters (36 feet) of rain falling every year.
- In contrast, Antofagasta in Chile is among the driest places on the planet, getting less than 0.1mm (0.004 inches) per year, with some years recording virtually no rainfall.
- Nearly 1,650 thunderstorm cells are estimated over the planet at any given time.
For more detailed information about Porto's weather, including sunshine hours, humidity levels, and temperature data, visit our Porto Climate page.
Porto Weather by Month
Pick a month to see the average temperature, rainfall and sunshine in Porto - and find the best time to visit.
Porto 3-Day Forecast
Temperature Rainfall Sunshine Humidity Wind Speed Water Temp
See the full Porto climate overview or explore weather in Portugal.
Popular this month
Where to go in August - average daytime high across popular destinations.
Bucket list
Need travel inspiration? Check out our bucket list articles and be inspired.
 7 of the most budget-friendly destinations in Europe
Discover Europe's top budget-friendly destinations including Budapest, Kotor, Krakow, and more, perfect for affordable and exciting travel.
 Alentejo, where time stands still
The quiet region is known for its rolling green hills and it is a true hiking paradise. Architectural highlights can be found in the castles, ancient monasteries or when exploring the countless charming villages.
An eco-friendly guide to Lagos travel
Lagos, Portugal is a great place to visit while being careful about your environmental footprint. Here you find some tips about environmentally places to stay, where to eat and how to get around in the area.
What to do in Lisbon: our tips for an unforgettable city trip
Lisbon is a bustling city with many special places. In this article you find the best sights, good restaurants and nice places to stay in Lisbon.