Maturín Monthly Rainfall & Precipitation
This page shows both the average monthly rainfall and the number of rainy days in Maturín, Venezuela. These averages rely on historical data collected over 30 years, from 1990 to 2020. Let's now guide you through the details for a complete overview.
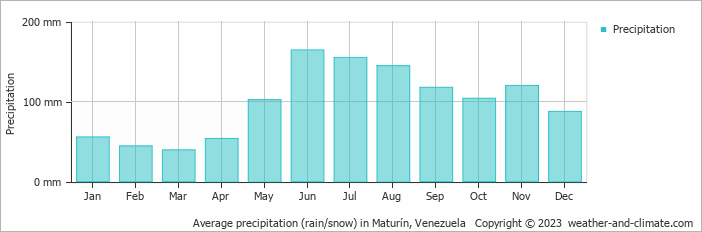
Maturín has a relatively rainy climate with high precipitation levels, averaging 1187 mm (47 in) of rainfall annually.
Monthly Rainfall & Rainy Days
Monthly Precipitation Levels
The average number of days each month with precipitation (> 0.2 mm (0.01 in))
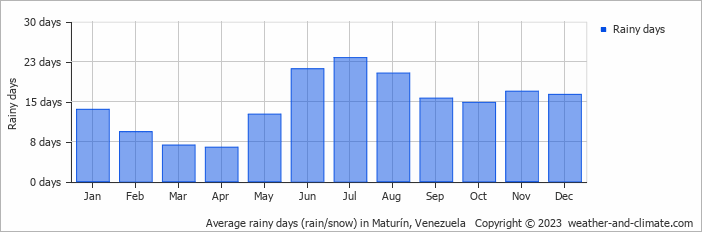
The seasons in Maturín, bring significant changes in precipitation. The wettest month, June, receives heavy rainfall, with an average of 164 mm (6.5 in) of precipitation. This rainfall is distributed across 21 rainy days.
In contrast, the driest month, March, experiences much less rainfall, totaling 39 mm (1.5 in) over 7 rainy days. These distinct seasonal differences provide diverse experiences throughout the year.June, the wettest month, has a maximum daytime temperature of 32°C (90°F). The city receives 168 hours of sunshine in this period. During the driest month March you can expect a temperature of 33°C (91°F). For more detailed insights into the city's temperatures, visit our Maturín Temperature page.
Explore Maturín's Historical Precipitation: 1976-2026
Browse day-by-day precipitation records for Maturín spanning 51 years. Select any month and year to see actual rainfall and snowfall recorded on each day.
Annual Rainfall in Venezuela: City Comparison
The map below shows the annual precipitation across Venezuela. You can also select the different months in case you are interested in a specific month.
Maturín vs World: Rainfall Compared
Maturín's average annual precipitation is 1187 mm (47 in). Let's compare this to some popular worldwide tourist destinations:
In Toronto, Canada, annual precipitation averages 964 mm (38 in), with snowy winters and rainy summers.
In Shanghai, China, the annual average precipitation is 1347 mm (53 in), with a humid subtropical climate.
In Brisbane, Australia, the annual precipitation is 979 mm (39 in), making it wetter than Sydney.
Ho Chi Minh City, Vietnam, receives 1955 mm (77 in) of annual rainfall, with a pronounced wet season from May to November, typical of its tropical monsoon climate.
Precipitation amounts are measured using specific gauges installed at weather stations, collecting both rain and snow and any other type of precipitation. Rainfall is measured directly in millimeters, while that from snow and ice is obtained by melting it. Automated systems often incorporate heaters to make this easier.
Information from these stations is transmitted via Wi-Fi, satellite, GPS, or telephone connections to central monitoring networks. This information is immediately updated and integrated into weather models and forecasts.
Precipitation has a very strong role in determining the local climate and ecosystem:
- Changing Rainfall Patterns: Global warming causes drastic changes in the patterns of rainfall. Some areas have been experiencing increased frequency and intensity of rainfall, while other areas experience longer dry spells or even droughts.
- Local Impacts: Many regions are experiencing heavier rainfall in the winter months and drier, hotter summers. This affects agriculture, water resources, and ecosystems.
- Mawsynram in India is noted as being the wettest place on earth, with over 11 meters (36 feet) of rain falling every year.
- In contrast, Antofagasta in Chile is among the driest places on the planet, getting less than 0.1mm (0.004 inches) per year, with some years recording virtually no rainfall.
- Nearly 1,650 thunderstorm cells are estimated over the planet at any given time.
For more detailed information about Maturín's weather, including sunshine hours, humidity levels, and temperature data, visit our Maturín Climate page.
Maturín Weather by Month
Pick a month to see the average temperature, rainfall and sunshine in Maturín - and find the best time to visit.
Maturín 3-Day Forecast
Temperature Rainfall Sunshine Humidity Wind Speed
See the full Maturín climate overview or explore weather in Venezuela.
Popular this month
Where to go in August - average daytime high across popular destinations.
Bucket list
Need travel inspiration? Check out our bucket list articles and be inspired.
 Visit Angel Falls
There are many Waterfalls in South Amerika to visit, however The Angel Falls is a waterfall like no other. This world heritage park needs to undoubtedly be on your bucket list.
Go to Merida in Venezuela
Mérida is a laidback backpacker city and is full of students. The university city is the cultural center of the Andes and with a special location at 1700 meters a must for every traveler.
 Mount Roraima is one of the most spectacular treks in Latin America
Mount Roraima, the feeling is indescribable. This is where the world seems to stop. As if you are on the roof of the world. Something you need to add to the bucket list.