Nyborg Temperature by Month
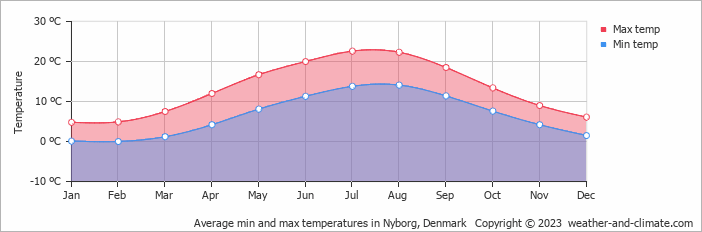
Nyborg in Funen, Denmark sees significant seasonal temperature differences, with daytime highs between 5°C (41°F) in January and 23°C (73°F) in July, averaging 13°C (55°F) annually. Explore the full monthly breakdown below.
Nyborg Monthly Temperatures
The weather in Nyborg experiences significant differences between warm and cold seasons, with big shifts in temperature. At night, minimum temperatures range from 14°C (57°F) in July to 0°C (32°F) in January.
The chart below illustrates the average maximum day and minimum night temperatures in Nyborg by month:
The coldest point of the day usually falls between 4 AM and 6 AM, with temperatures peaking around 3 PM. July, the city's warmest month, gets 258 hours of sunshine.
The chart below shows the average temperature throughout the year:
Temperature: Nyborg vs Denmark
The map below shows the annual temperature across Denmark. You can also select individual months if you want to compare a specific time of year.
 very warm
 warm
warm
 pleasant
 moderate
 cold
cold
 very cold
Nyborg vs World: Temperature Compared
Nyborg's average annual maximum temperature is 13°C (55°F). To put that in context, here's how it compares to a few well-known destinations:
Lisbon, Portugal averages 21°C (70°F) annually, warm summers, mild winters, and rain mainly in the cooler months.
On the cooler end, Oslo, Norway averages just 10°C (50°F) annually, with pleasant summers but long, cold winters.
Buenos Aires, Argentina averages 23°C (73°F) a year, with hot summers and mild winters, and seasons reversed compared to Europe.
Melbourne, Australia averages 20°C (68°F) annually, known for unpredictable weather, with four seasons sometimes happening in one day.
What Does the Temperature Feel Like in Nyborg?
Temperature alone doesn't tell the whole story, humidity plays a big role in how warm or cold it actually feels. High humidity in summer makes the heat feel more intense, particularly once temperatures climb above 25°C. In winter, the same humidity can make cold air feel sharper than the thermometer suggests.
In the cooler months, when temperatures drop below 10°C, high humidity makes the cold feel more cutting than it would in dry conditions.
In Nyborg, January is the coolest month, with average highs of 5°C (41°F) and humidity around 88%, considered very high. For a full picture, see our humidity page.
Climate temperature data is typically calculated as a 30-year average. This smooths out year-to-year variability and gives a more reliable picture of what a place is actually like, rather than what happened in any single unusual year.
The readings come from a range of sources, land-based weather stations, ocean buoys, ships, and satellites. That data is collected by weather services around the world, then pooled, quality-checked, and averaged to produce the climate records you see here.
Global average temperatures have risen by around 1.2°C since the pre-industrial era, and the effects are visible across many regions. Winters are milder on average, with fewer frost days and less snow in many parts of the world. Heatwaves are more frequent and more intense, and Europe's summers of 2018, 2019, and 2020 all set records.
Summers are also getting drier in some areas, while winter rainfall has increased in others. This contributies to higher river levels and more flooding. In many countries, spring arrives earlier and autumn lasts longer. It has knock-on effects for wildlife, agriculture, and local ecosystems.
For more on Nyborg's weather, including monthly rainfall, sunshine hours, and humidity, visit our Nyborg climate page.


