Mogra Temperature by Month
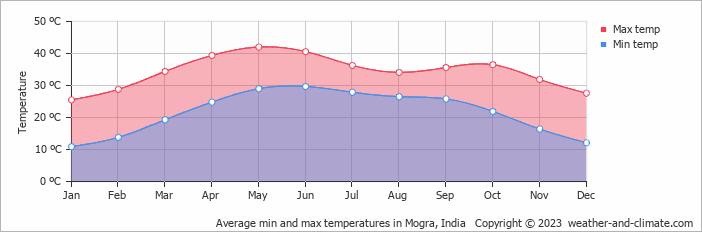
Mogra in India sees significant seasonal temperature differences, with daytime highs between 26°C (79°F) in January and 42°C (108°F) in May, averaging 34°C (93°F) annually. Explore the full monthly breakdown below.
Mogra Monthly Temperatures
In Mogra, temperatures can shift dramatically between very hot in summer and warm in winter. Nights follow the same pattern, with lows ranging from 29°C (84°F) in May to 11°C (52°F) in January.
The chart below illustrates the average maximum day and minimum night temperatures in Mogra by month:
Temperatures tend to bottom out between 4 AM and 6 AM, then climb to their daily peak around 3 PM. May, the warmest month, sees 284 hours of sunshine.
The chart below shows the average temperature throughout the year:
Temperature: Mogra vs India
The map below shows the annual temperature across India. You can also select individual months if you want to compare a specific time of year.
Mogra vs World: Temperature Compared
Mogra's average annual maximum temperature is 34°C (93°F). To put that in context, here's how it compares to a few well-known destinations:
Athens, Greece sits at 23°C (73°F) on average, with hot dry summers and mild winters characteristic of the Mediterranean.
Reykjavík, Iceland averages 9°C (48°F) a year, mild summers by Icelandic standards, but cold winters and frequent wind.
Buenos Aires, Argentina averages 23°C (73°F) a year, with hot summers and mild winters, and seasons reversed compared to Europe.
Brisbane, Australia averages 26°C (79°F) a year, with warm winters and hot, humid summers.
What Does the Temperature Feel Like in Mogra?
Temperature alone doesn't tell the whole story, humidity plays a big role in how warm or cold it actually feels. High humidity in summer makes the heat feel more intense, particularly once temperatures climb above 25°C. In winter, the same humidity can make cold air feel sharper than the thermometer suggests.
In Mogra, January is the coolest month, with average highs of 26°C (79°F) and humidity around 27%, considered low. In May, the warmest month, temperatures average 42°C (108°F) with 20% humidity, conditions that feel low. For a full picture, see our humidity page.
Climate temperature data is typically calculated as a 30-year average. This smooths out year-to-year variability and gives a more reliable picture of what a place is actually like, rather than what happened in any single unusual year.
The readings come from a range of sources, land-based weather stations, ocean buoys, ships, and satellites. That data is collected by weather services around the world, then pooled, quality-checked, and averaged to produce the climate records you see here.
Whether a city sits on the coast or deep inland makes a significant difference to its climate. Coastal areas tend to have more stable temperatures year-round, large bodies of water absorb heat slowly in summer and release it gradually in winter, keeping extremes in check. Cities far from the sea don't benefit from that buffer, which is why continental climates tend to have hotter summers and colder winters than their coastal counterparts at the same latitude.
For more on Mogra's weather, including monthly rainfall, sunshine hours, and humidity, visit our Mogra climate page.
Mogra Weather by Month
Pick a month to see the average temperature, rainfall and sunshine in Mogra - and find the best time to visit.
Mogra 3-Day Forecast
Temperature Rainfall Sunshine Humidity
See the full Mogra climate overview or explore weather in India.
Popular this month
Where to go in July - average daytime high across popular destinations.
Bucket list
Need travel inspiration? Check out our bucket list articles and be inspired.
 A paradise called Andaman Islands
Though officially Indian, the Andamans are nearer Myanmar, Indonesia, and Thailand, resulting in amazing, budget-friendly white-sand beaches.
The 5 most beautiful monasteries in Ladakh
Explore Ladakh's spiritual essence through its incredible Buddhist monasteries. See architectural wonders, rich traditions, and serene landscapes in this guide.
Sleeping under the stars and riding camels in Rajasthan
A desert safari in Jaisalmer is definitely one of the highlights during a visit to India. Spending a night in the desert is a great adventurous bucket list experience.
Avoid mass tourism on an eco boat in the backwaters of Kerala
We can tell you now how you can avoid being surrounded by tourists and at the same time minimize your impact on the environment.