Honfleur Temperature by Month
The average annual maximum temperature in Honfleur, Lower Normandy, France is 16°C (61°F), with daytime highs ranging from 9°C (48°F) in January to 23°C (73°F) in August. This page covers monthly averages, day-night differences, and how Honfleur compares to cities worldwide.
Honfleur Monthly Temperatures
The climate in Honfleur is dynamic, ranging widely from chilly in winter to comfortable in summer. Nights are significantly colder, with lows dropping from 15°C (59°F) in August to 3°C (37°F) in January.
The chart below illustrates the average maximum day and minimum night temperatures in Honfleur by month:
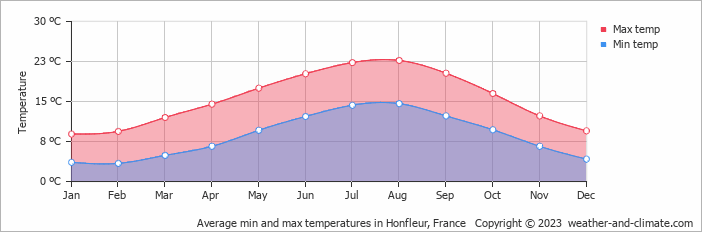
The coolest part of the day is typically between 4 AM and 6 AM, while 3 PM is usually the warmest, when solar heating is at its peak. August, the city's warmest month, averages 217 hours of sunshine.
The chart below shows the average temperature throughout the year:
Daily Historical Temperatures
Average high and low temperatures for each day of the month based on long-term records. 50-year average (1976-2025)
Average temperatures in August
Historical Honfleur Temperatures: 1976-2026
Browse day-by-day temperature records for Honfleur spanning 51 years. Select any month and year to see actual high and low temperatures recorded on each day.
Temperature: Honfleur vs France
The map below shows the annual temperature across France. You can also select individual months if you want to compare a specific time of year.
Honfleur vs World: Temperature Compared
Honfleur's average annual maximum temperature is 16°C (61°F). To put that in context, here's how it compares to a few well-known destinations:
Seville, Spain averages 23°C (73°F) a year, one of the warmer cities in Western Europe, with long hot summers.
Glasgow, Scotland averages 13°C (55°F) a year, mild but often grey, with cold winters and rarely hot summers.
Buenos Aires, Argentina averages 23°C (73°F) a year, with hot summers and mild winters, and seasons reversed compared to Europe.
Brisbane, Australia averages 26°C (79°F) a year, with warm winters and hot, humid summers.
What Does the Temperature Feel Like in Honfleur?
Temperature alone doesn't tell the whole story, humidity plays a big role in how warm or cold it actually feels. High humidity in summer makes the heat feel more intense, particularly once temperatures climb above 25°C. In winter, the same humidity can make cold air feel sharper than the thermometer suggests.
In the cooler months, when temperatures drop below 10°C, high humidity makes the cold feel more cutting than it would in dry conditions.
In Honfleur, January is the coolest month, with average highs of 9°C (48°F) and humidity around 86%, considered very high. For a full picture, see our humidity page.
Climate temperature data is typically calculated as a 30-year average. This smooths out year-to-year variability and gives a more reliable picture of what a place is actually like, rather than what happened in any single unusual year.
The readings come from a range of sources, land-based weather stations, ocean buoys, ships, and satellites. That data is collected by weather services around the world, then pooled, quality-checked, and averaged to produce the climate records you see here.
Global average temperatures have risen by around 1.2°C since the pre-industrial era, and the effects are visible across many regions. Winters are milder on average, with fewer frost days and less snow in many parts of the world. Heatwaves are more frequent and more intense, and Europe's summers of 2018, 2019, and 2020 all set records.
Summers are also getting drier in some areas, while winter rainfall has increased in others. This contributies to higher river levels and more flooding. In many countries, spring arrives earlier and autumn lasts longer. It has knock-on effects for wildlife, agriculture, and local ecosystems.
For more on Honfleur's weather, including monthly rainfall, sunshine hours, and humidity, visit our Honfleur climate page.
Honfleur Weather by Month
Pick a month to see the average temperature, rainfall and sunshine in Honfleur - and find the best time to visit.
Honfleur 3-Day Forecast
Temperature Rainfall Sunshine Humidity
See the full Honfleur climate overview or explore weather in France.
Popular this month
Where to go in August - average daytime high across popular destinations.
Bucket list
Need travel inspiration? Check out our bucket list articles and be inspired.
 The 10 most charming villages in France
Discover France's top 10 beautiful villages. From Normandy to the Côte d'Azur, experience quaint squares and cobbled streets. Which one will you visit this summer?
An alternative way to discover Paris
From street art, vintage shops, vegetarian cafes, to amazing cultural events, Paris has much to offer for the creative traveler. An overview of sights that you must see if you want to visit this city in an alternative way.
Nature is allowed to take its course in the Ardeche
The Ardèche is France at its most beautiful. The authentic villages and breathtaking mountainous landscapes are one of the main reasons. he climate in Ardèche is very pleasant. Temperatures are high during summer and it is often very sunny.
 Explore the natural wonders of Corsica
Corsica offers an abundance of incredible natural wonders to explore. This stunning Mediterranean island is a paradise for outdoor enthusiasts and nature lovers alike.