
















 Iceland Airwaves Festival
On its way to its 20th edition in 2019 Iceland Airwaves is a festival you need to visit once in your life. Everything from lagoons and bookstores to bars and concert halls is filled with music.
Hallormsstaður in East Iceland, Iceland sees significant seasonal temperature differences, with daytime highs between 0°C (32°F) in December and 13°C (55°F) in July, averaging 5°C (41°F) annually. Explore the full monthly breakdown below.
In Hallormsstaður, temperatures differ significantly between summer and winter months. Nighttime lows reflect this range, dropping from 7°C (45°F) in July to -7°C (19°F) in December.
The chart below illustrates the average maximum day and minimum night temperatures in Hallormsstaður by month:
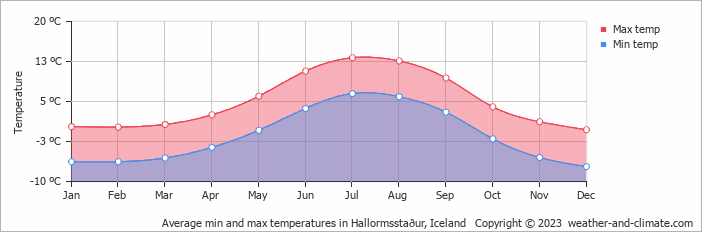
The coldest point of the day usually falls between 4 AM and 6 AM, with temperatures peaking around 3 PM.
The chart below shows the average temperature throughout the year:
The map below shows the annual temperature across Iceland. You can also select individual months if you want to compare a specific time of year.
Hallormsstaður's average annual maximum temperature is 5°C (41°F). To put that in context, here's how it compares to a few well-known destinations:
Athens, Greece sits at 23°C (73°F) on average, with hot dry summers and mild winters characteristic of the Mediterranean.
Glasgow, Scotland averages 13°C (55°F) a year, mild but often grey, with cold winters and rarely hot summers.
Buenos Aires, Argentina averages 23°C (73°F) a year, with hot summers and mild winters, and seasons reversed compared to Europe.
Adelaide, Australia averages 21°C (70°F) a year, with warm summers, mild winters, and relatively low rainfall year-round.
Climate temperature data is typically calculated as a 30-year average. This smooths out year-to-year variability and gives a more reliable picture of what a place is actually like, rather than what happened in any single unusual year.
The readings come from a range of sources, land-based weather stations, ocean buoys, ships, and satellites. That data is collected by weather services around the world, then pooled, quality-checked, and averaged to produce the climate records you see here.
Seasonal temperature shifts influence more than just how warm it feels, they also drive changes in rainfall, cloud cover, and wind patterns throughout the year.
Warmer air holds more moisture, which tends to mean heavier or more frequent rain during the warmer months. When temperatures drop in winter, any precipitation that does fall is more likely to come as snow or sleet, though in Hallormsstaður this rarely lasts long on the ground.
For more on Hallormsstaður's weather, including monthly rainfall, sunshine hours, and humidity, visit our Hallormsstaður climate page.
Pick a month to see the average temperature, rainfall and sunshine in Hallormsstaður - and find the best time to visit.
Temperature Rainfall
See the full Hallormsstaður climate overview or explore weather in Iceland.
Where to go in October - average daytime high across popular destinations.
Keflavík 8°C (46°F) Hella9°C (48°F) Selfoss
 8°C (46°F) Kópavogur8°C (46°F) Höfn7°C (45°F) Reykjavík8°C (46°F) Egilsstadir5°C (41°F) Akureyri4°C (39°F)
 Need travel inspiration? Check out our bucket list articles and be inspired.
Iceland Airwaves Festival
On its way to its 20th edition in 2019 Iceland Airwaves is a festival you need to visit once in your life. Everything from lagoons and bookstores to bars and concert halls is filled with music.
 Where to stay in Iceland: Nordic idyll that feels like home
If you are travelling to Iceland for the first time, the Golden Circle will probably make it onto your bucket list. Geysir Hestar is located right in between two spectacular sights of the Golden Circle.
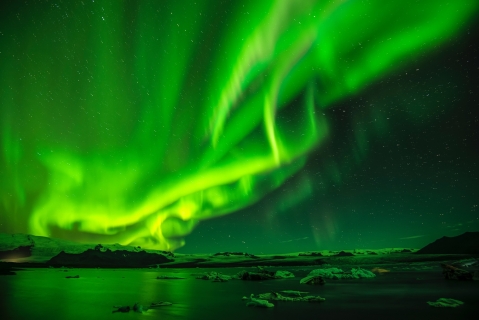
 See the northern lights
The northern lights, polar light or Aarora Borealis is a true spectacle of nature! Green, sometimes purple, red and yellow streaks of light colors the dark skies.

 The 10 most charming villages in France
Discover France's top 10 beautiful villages. From Normandy to the Côte d'Azur, experience quaint squares and cobbled streets. Which one will you visit this summer?