

Gupta Kāshi Temperatures: Monthly Averages and Year-Round Insights
On this page, we’ll explore Gupta Kāshi’s temperature statistics in detail, including day and night variations and monthly averages. We’ll also compare the annual temperature to other cities in India.
Monthly Temperature Averages
In Gupta Kāshi, temperatures can shift dramatically between pleasant in summer and cold in winter. Average maximum daytime temperatures reach a pleasant 21°C in July. In January, the coolest month of the year, temperatures drop to a chilly 7°C. At night, minimum temperatures can drop even lower, averaging around -5°C.
The chart below illustrates the average maximum day and minimum night temperatures in Gupta Kāshi by month:
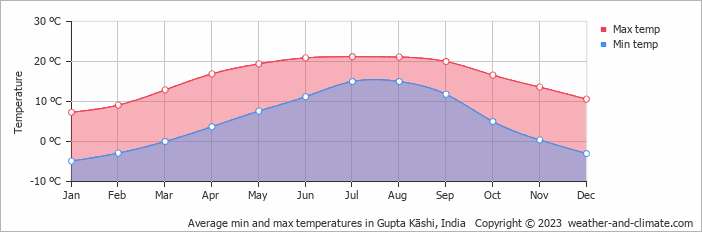
The minimum temperature is often recorded between 4 AM and 6 AM, while the highest temperature is usually reached at 3 PM. During this time the sun's heating effect is the strongest.
The chart below shows the average temperature throughout the year:
January, the city’s coldest month, sees about 86 mm of rainfall spread over roughly 3 days.
Annual Temperatures in India Compared
The map below shows the annual temperature across India. You can also select the different months in case you are interested in a specific month.
 very warm
 warm
warm
 pleasant
 moderate
 cold
cold
 very cold
Gupta Kāshi Temperatures Compared World Wide
Gupta Kāshi’s average annual maximum temperature is 16°C. Let’s compare this with some popular tourist destinations:
Seville, Spain, stands out with its warm Mediterranean climate and an average annual temperature of 23°C.
In Toronto, Canada, the average annual temperature is 13°C, with snowy winters and warm summers.
Beijing, China, experiences more extreme temperature shifts, but still averaging 20°C annually.
Adelaide, Australia, enjoys warm summers and mild winters, with an average annual temperature of 21°C.
How are these Temperatures Measured?
Generally, temperature data depicting climate is usually given over a 30-year average in order to reduce short-term fluctuations and reveal better long-term trends in climate conditions.
This temperature data is taken from land-based thermometers, ocean buoys, ships, and satellites. These measurements are transmitted to weather stations and climate centers around the globe where they are processed, averaged, and analyzed in order to monitor the trends and create climate models.
Sea vs. Land Temperatures
The influence of nearby oceans or large water bodies significantly affects local temperatures:
- Ocean Influence: Coastal regions tend to have more stable temperatures, as large bodies of water absorb and release heat slowly. This often results in milder winters and cooler summers compared to inland areas.
- Continental Climates: Landmasses well away from large bodies of water tend to show greater extremes in temperature, having hotter summers and colder winters because of the absence of water as a moderating influence.
For more detailed information about Gupta Kāshi’s weather, including monthly rainfall, sunshine hours, and humidity levels, visit our Gupta Kāshi climate page.
Current temperature in Gupta Kāshi
 1 m/s
1 m/s
almost clear and no rain
2 m/s
clear and no rain
2 m/s
clear and no rain