Dunquin Temperature by Month
Dunquin, Kerry, Ireland has an average annual maximum temperature of 14°C (57°F), with moderate seasonal shifts ranging from 11°C (52°F) in February to 18°C (64°F) in August. Below you'll find a full monthly breakdown and a comparison with cities worldwide.
Dunquin Monthly Temperatures
The climate in Dunquin experiences moderate temperature changes, with mild shifts between seasons. At night, temperatures range from 14°C (57°F) in August to 6°C (43°F) in February.
The chart below illustrates the average maximum day and minimum night temperatures in Dunquin by month:
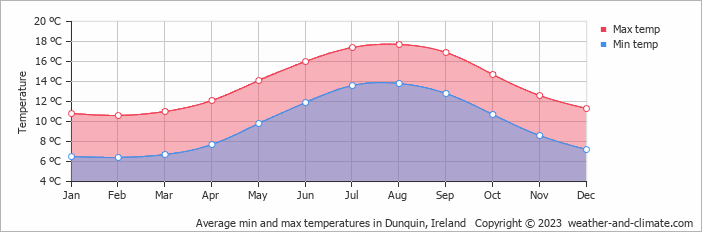
The minimum temperature is often recorded between 4 AM and 6 AM, while the highest temperature is usually reached at 3 PM, when the sun's heating effect is strongest. August, the warmest month, gets 139 hours of sunshine.
The chart below shows the average temperature throughout the year:
Temperature: Dunquin vs Ireland
The map below shows the annual temperature across Ireland. You can also select individual months if you want to compare a specific time of year.
Dunquin vs World: Temperature Compared
Dunquin's average annual maximum temperature is 14°C (57°F). To put that in context, here's how it compares to a few well-known destinations:
Barcelona, Spain has an annual average of around 21°C (70°F), with warm summers and mild, fairly short winters.
Zermatt, Switzerland averages just 4°C (39°F) annually due to its altitude, with very cold winters and cool summers even at its warmest.
Shanghai, China averages 21°C (70°F) a year, with warm summers, mild winters, and a noticeable spring and autumn.
Brisbane, Australia averages 26°C (79°F) a year, with warm winters and hot, humid summers.
What Does the Temperature Feel Like in Dunquin?
Temperature alone doesn't tell the whole story, humidity plays a big role in how warm or cold it actually feels. High humidity in summer makes the heat feel more intense, particularly once temperatures climb above 25°C. In winter, the same humidity can make cold air feel sharper than the thermometer suggests.
In the cooler months, when temperatures drop below 10°C, high humidity makes the cold feel more cutting than it would in dry conditions.
In Dunquin, February is the coolest month, with average highs of 11°C (52°F) and humidity around 76%, considered high. For a full picture, see our humidity page.
Climate temperature data is typically calculated as a 30-year average. This smooths out year-to-year variability and gives a more reliable picture of what a place is actually like, rather than what happened in any single unusual year.
The readings come from a range of sources, land-based weather stations, ocean buoys, ships, and satellites. That data is collected by weather services around the world, then pooled, quality-checked, and averaged to produce the climate records you see here.
Seasonal temperature shifts influence more than just how warm it feels, they also drive changes in rainfall, cloud cover, and wind patterns throughout the year.
Warmer air holds more moisture, which tends to mean heavier or more frequent rain during the warmer months. When temperatures drop in winter, any precipitation that does fall is more likely to come as snow or sleet, though in Dunquin this rarely lasts long on the ground.
For more on Dunquin's weather, including monthly rainfall, sunshine hours, and humidity, visit our Dunquin climate page.
Dunquin Weather by Month
Pick a month to see the average temperature, rainfall and sunshine in Dunquin - and find the best time to visit.
Dunquin 3-Day Forecast
Temperature Rainfall Sunshine Humidity
See the full Dunquin climate overview or explore weather in Ireland.
Popular this month
Where to go in August - average daytime high across popular destinations.
Bucket list
Need travel inspiration? Check out our bucket list articles and be inspired.
 Go to Dingle in Ireland
Dolphins, Whales and breathtaking views. The colorful fishing village Dingle in Ireland has it all and this town is a must for your bucket list.
An Irish adventure like no other in Killarney National Park
Head down to the South West part of the country, County Kerry, to the small town of Killarney. If you want to experience what Ireland is really all about
Horseback riding in Ireland
Ireland is the most ideal place in the world for horseback riding. Combine this with the most hospitable people you will ever encounter and you have an unforgettable dream trip to add to your bucket list.