Cikundul Temperature by Month
The average annual maximum temperature in Cikundul, Indonesia is 30°C (86°F), with little variation between seasons. This page covers monthly averages, day-night differences, and how Cikundul compares to cities worldwide.
Cikundul Monthly Temperatures
Cikundul enjoys a stable climate with temperatures staying pretty much the same throughout the year. Maximum daytime temperatures range from a comfortable 29°C (84°F) in February to a very warm 31°C (88°F) in September. Nights are consistently cool, with lows between 21°C (70°F) and 21°C (70°F).
The chart below illustrates the average maximum day and minimum night temperatures in Cikundul by month:
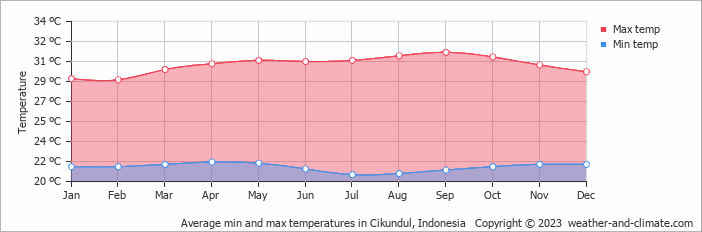
The coolest part of the day is typically between 4 AM and 6 AM, while 3 PM is usually the warmest, when solar heating is at its peak. September, the city's warmest month, averages 288 hours of sunshine.
The chart below shows the average temperature throughout the year:
Temperature: Cikundul vs Indonesia
The map below shows the annual temperature across Indonesia. You can also select individual months if you want to compare a specific time of year.
Cikundul vs World: Temperature Compared
Cikundul's average annual maximum temperature is 30°C (86°F). To put that in context, here's how it compares to a few well-known destinations:
Barcelona, Spain has an annual average of around 21°C (70°F), with warm summers and mild, fairly short winters.
Interlaken, Switzerland averages 8°C (46°F) a year, with cold winters and cool summers thanks to its Alpine setting.
Chicago, USA averages 15°C (59°F) annually, known for extreme seasonal swings, from bitterly cold winters to warm summers.
Melbourne, Australia averages 20°C (68°F) annually, known for unpredictable weather, with four seasons sometimes happening in one day.
What Does the Temperature Feel Like in Cikundul?
Temperature alone doesn't tell the whole story, humidity plays a big role in how warm or cold it actually feels. High humidity in summer makes the heat feel more intense, particularly once temperatures climb above 25°C. In winter, the same humidity can make cold air feel sharper than the thermometer suggests.
In Cikundul, February is the coolest month, with average highs of 29°C (84°F) and humidity around 85%, considered very high. In September, the warmest month, temperatures average 31°C (88°F) with 71% humidity, conditions that feel high. For a full picture, see our humidity page.
Climate temperature data is typically calculated as a 30-year average. This smooths out year-to-year variability and gives a more reliable picture of what a place is actually like, rather than what happened in any single unusual year.
The readings come from a range of sources, land-based weather stations, ocean buoys, ships, and satellites. That data is collected by weather services around the world, then pooled, quality-checked, and averaged to produce the climate records you see here.
Global average temperatures have risen by around 1.2°C since the pre-industrial era, and the effects are visible across many regions. Winters are milder on average, with fewer frost days and less snow in many parts of the world. Heatwaves are more frequent and more intense, and Europe's summers of 2018, 2019, and 2020 all set records.
Summers are also getting drier in some areas, while winter rainfall has increased in others. This contributies to higher river levels and more flooding. In many countries, spring arrives earlier and autumn lasts longer. It has knock-on effects for wildlife, agriculture, and local ecosystems.
For more on Cikundul's weather, including monthly rainfall, sunshine hours, and humidity, visit our Cikundul climate page.
Cikundul Weather by Month
Pick a month to see the average temperature, rainfall and sunshine in Cikundul - and find the best time to visit.
Cikundul 3-Day Forecast
Temperature Rainfall Sunshine Humidity
See the full Cikundul climate overview or explore weather in Indonesia.
Popular this month
Where to go in August - average daytime high across popular destinations.
Bucket list
Need travel inspiration? Check out our bucket list articles and be inspired.
 10 Hidden gems in Asia you need to visit
Explore 10 hidden gems in Asia offering authentic experiences, from pristine beaches and remote islands to cultural treks and peaceful mountain villages.
The ultimate guide to Ubud – everything you need to know to escape the crowds
There is a way to experience Ubud in a fantastic less crowded way and this article will be your guide how to do that. Find the best places to stay, where to eat and much more.
Top 5 hidden gem islands in Indonesia
Discover Indonesia's secret islands: pristine beaches, rich history, and vibrant culture await beyond Bali and Java. Dive into untouched paradise.
Six Organic Farms & Farmstays in Indonesia
We've compiled a list of organic farms in Indonesia that have a positive impact on their communities - they could use your help during this pandemic.