Chandrapur Temperature by Month
Chandrapur, Maharashtra, India has an average annual maximum temperature of 35°C (95°F), ranging from 31°C (88°F) in January to 43°C (109°F) in May. Below you'll find a full monthly breakdown and a comparison with cities worldwide.
Chandrapur Monthly Temperatures
With significant temperature fluctuations, Chandrapur enjoys distinct seasons year-round. Nighttime lows range from 31°C (88°F) in May to 16°C (61°F) in January.
The chart below illustrates the average maximum day and minimum night temperatures in Chandrapur by month:
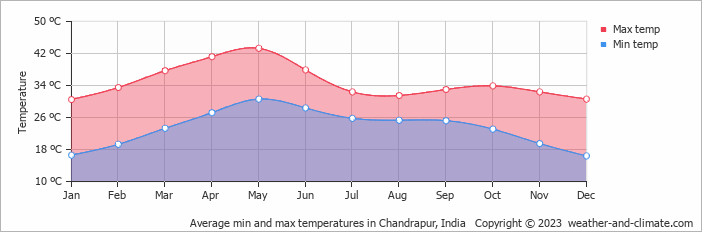
Low temperatures are most often recorded between 4 AM and 6 AM, while highs typically occur around 3 PM.
The chart below shows the average temperature throughout the year:
Temperature: Chandrapur vs India
The map below shows the annual temperature across India. You can also select individual months if you want to compare a specific time of year.
Chandrapur vs World: Temperature Compared
Chandrapur's average annual maximum temperature is 35°C (95°F). To put that in context, here's how it compares to a few well-known destinations:
Athens, Greece sits at 23°C (73°F) on average, with hot dry summers and mild winters characteristic of the Mediterranean.
On the cooler end, Oslo, Norway averages just 10°C (50°F) annually, with pleasant summers but long, cold winters.
Seoul, South Korea averages 18°C (64°F) a year, with four clear seasons, cold winters, and hot humid summers.
Melbourne, Australia averages 20°C (68°F) annually, known for unpredictable weather, with four seasons sometimes happening in one day.
Climate temperature data is typically calculated as a 30-year average. This smooths out year-to-year variability and gives a more reliable picture of what a place is actually like, rather than what happened in any single unusual year.
The readings come from a range of sources, land-based weather stations, ocean buoys, ships, and satellites. That data is collected by weather services around the world, then pooled, quality-checked, and averaged to produce the climate records you see here.
Global average temperatures have risen by around 1.2°C since the pre-industrial era, and the effects are visible across many regions. Winters are milder on average, with fewer frost days and less snow in many parts of the world. Heatwaves are more frequent and more intense, and Europe's summers of 2018, 2019, and 2020 all set records.
Summers are also getting drier in some areas, while winter rainfall has increased in others. This contributies to higher river levels and more flooding. In many countries, spring arrives earlier and autumn lasts longer. It has knock-on effects for wildlife, agriculture, and local ecosystems.
For more on Chandrapur's weather, including monthly rainfall, sunshine hours, and humidity, visit our Chandrapur climate page.
Chandrapur Weather by Month
Pick a month to see the average temperature, rainfall and sunshine in Chandrapur - and find the best time to visit.
Chandrapur 3-Day Forecast
Temperature Rainfall
See the full Chandrapur climate overview or explore weather in India.
Popular this month
Where to go in July - average daytime high across popular destinations.
Bucket list
Need travel inspiration? Check out our bucket list articles and be inspired.
 A paradise called Andaman Islands
Though officially Indian, the Andamans are nearer Myanmar, Indonesia, and Thailand, resulting in amazing, budget-friendly white-sand beaches.
The 5 most beautiful monasteries in Ladakh
Explore Ladakh's spiritual essence through its incredible Buddhist monasteries. See architectural wonders, rich traditions, and serene landscapes in this guide.
Sleeping under the stars and riding camels in Rajasthan
A desert safari in Jaisalmer is definitely one of the highlights during a visit to India. Spending a night in the desert is a great adventurous bucket list experience.
Avoid mass tourism on an eco boat in the backwaters of Kerala
We can tell you now how you can avoid being surrounded by tourists and at the same time minimize your impact on the environment.