Caraguatatuba Temperature by Month
Caraguatatuba, São Paulo State, Brazil has a consistently comfortable climate year-round, with daytime highs averaging 25°C (77°F). Below you'll find a full monthly breakdown and a comparison with cities worldwide.
Caraguatatuba Monthly Temperatures
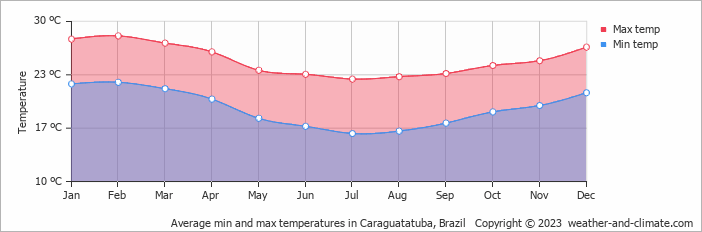
With minimal seasonal shifts, Caraguatatuba experiences a constant climate year-round. Maximum daytime temperatures range from a comfortable 28°C (82°F) in February to a comfortable 23°C (73°F) in July. At night, temperatures range from 22°C (72°F) in February to 16°C (61°F) in July.
The chart below illustrates the average maximum day and minimum night temperatures in Caraguatatuba by month:
The coolest part of the day is typically between 4 AM and 6 AM, while 3 PM is usually the warmest, when solar heating is at its peak. February, the city's warmest month, averages 108 hours of sunshine.
The chart below shows the average temperature throughout the year:
Temperature: Caraguatatuba vs Brazil
The map below shows the annual temperature across Brazil. You can also select individual months if you want to compare a specific time of year.
Caraguatatuba vs World: Temperature Compared
Caraguatatuba's average annual maximum temperature is 25°C (77°F). To put that in context, here's how it compares to a few well-known destinations:
Athens, Greece sits at 23°C (73°F) on average, with hot dry summers and mild winters characteristic of the Mediterranean.
Queenstown, New Zealand averages 10°C (50°F) annually, remember seasons are flipped, so its coldest months fall in June and July.
Osaka, Japan averages 22°C (72°F) annually, with hot humid summers, mild winters, and pleasant spring and autumn seasons.
Adelaide, Australia averages 21°C (70°F) a year, with warm summers, mild winters, and relatively low rainfall year-round.
Climate temperature data is typically calculated as a 30-year average. This smooths out year-to-year variability and gives a more reliable picture of what a place is actually like, rather than what happened in any single unusual year.
The readings come from a range of sources, land-based weather stations, ocean buoys, ships, and satellites. That data is collected by weather services around the world, then pooled, quality-checked, and averaged to produce the climate records you see here.
Global average temperatures have risen by around 1.2°C since the pre-industrial era, and the effects are visible across many regions. Winters are milder on average, with fewer frost days and less snow in many parts of the world. Heatwaves are more frequent and more intense, and Europe's summers of 2018, 2019, and 2020 all set records.
Summers are also getting drier in some areas, while winter rainfall has increased in others. This contributies to higher river levels and more flooding. In many countries, spring arrives earlier and autumn lasts longer. It has knock-on effects for wildlife, agriculture, and local ecosystems.
For more on Caraguatatuba's weather, including monthly rainfall, sunshine hours, and humidity, visit our Caraguatatuba climate page.
Caraguatatuba Weather by Month
Pick a month to see the average temperature, rainfall and sunshine in Caraguatatuba - and find the best time to visit.
Caraguatatuba 3-Day Forecast
See the full Caraguatatuba climate overview or explore weather in Brazil.
Popular this month
Where to go in July - average daytime high across popular destinations.
Bucket list
Need travel inspiration? Check out our bucket list articles and be inspired.
 The 10 most alternative cities in South America
Discover South America's top 10 alternative cities! From Valparaíso's vibrant streets to La Paz's high-altitude charm and Medellín's innovative spirit.
 The 5 most tranquil retreats in the Amazon Rainforest, Brazil
Discover top sustainable lodges in the Amazon. Enjoy unique wildlife, eco-friendly stays, and immersive experiences at Anavilhanas, Cristalino, and more.
An alternative way to discover Rio de Janeiro
Don't feel like seeing the traditional tourist sights in Rio de Janeiro? We have made an overview of the sights in Rio de Janeiro that you must see if you want to visit Rio in an alternative way.
Iguazu Falls
Iguazu Falls are among the largest waterfalls on earth. You will be speechless when you see this miracle of mother nature. They are included in the World Heritage List and have also been named one of the seven wonders of the world.