

Baraud Temperatures: Monthly Averages and Year-Round Insights
On this page, we’ll explore Baraud’s temperature statistics in detail, including day and night variations and monthly averages. We’ll also compare the annual temperature to other cities in India.
Monthly Temperature Averages
In Baraud, temperatures can shift dramatically between very hot in summer and pleasant in winter. Average maximum daytime temperatures reach a very hot 41°C in May. In January, the coolest month of the year, temperatures drop to a pleasant 22°C. At night, expect even cooler temperatures, with lows averaging around 9°C.
The chart below illustrates the average maximum day and minimum night temperatures in Baraud by month:
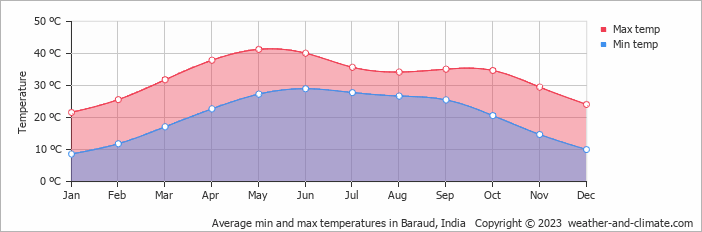
The minimum temperature is often recorded between 4 AM and 6 AM, while the highest temperature is usually reached at 3 PM. During this time the sun's heating effect is the strongest.
The chart below shows the average temperature throughout the year:
January, the city’s coldest month, sees about 17 mm of rainfall spread over roughly a single day.
Annual Temperatures in India Compared
The map below shows the annual temperature across India. You can also select the different months in case you are interested in a specific month.
 very warm
 warm
warm
 pleasant
 moderate
 cold
cold
 very cold
Baraud Temperatures Compared World Wide
Baraud’s average annual maximum temperature is 33°C. Let’s compare this with some popular tourist destinations:
Seville, Spain, stands out with its warm Mediterranean climate and an average annual temperature of 23°C.
Meanwhile, Queenstown, New Zealand, the average annual temperature is significantly lower at 10°C, with mild summers and cold winters.
Meanwhile, New York City, USA, experiences a more pronounced seasonal variation with an average annual temperature of 17°C.
In Tokyo, Japan, the average annual temperature is 21°C, expect warmer summers and milder winters.
How are these Temperatures Measured?
Generally, temperature data depicting climate is usually given over a 30-year average in order to reduce short-term fluctuations and reveal better long-term trends in climate conditions.
This temperature data is taken from land-based thermometers, ocean buoys, ships, and satellites. These measurements are transmitted to weather stations and climate centers around the globe where they are processed, averaged, and analyzed in order to monitor the trends and create climate models.
Global Warming and Its Effects
Climate change is affecting worldwide temperatures, including in Baraud. It has massive impacts on both local and global levels:
- Global Temperature Rise: The average global land and sea temperatures have risen by about 1.2°C since pre-industrial times.
-
Local Impacts: Most regions of the world are witnessing warmer winters with fewer frost and snowfall days. The global frequency and severity of heatwaves have increased. For example, Europe's summers of 2018, 2019, and 2020 all broke records. Summers are also becoming drier; however, during winter, inland regions have experienced increased rainfall. This has caused elevated river levels and more cases of flooding.
Many countries are experiencing earlier springs and later autumns. This is why some bird species have shifted their migration dates.
For more detailed information about Baraud’s weather, including monthly rainfall, sunshine hours, and humidity levels, visit our Baraud climate page.
Current temperature in Baraud
 4 m/s
4 m/s
almost clear and no rain
3 m/s
clear and no rain
2 m/s
clear and no rain