

















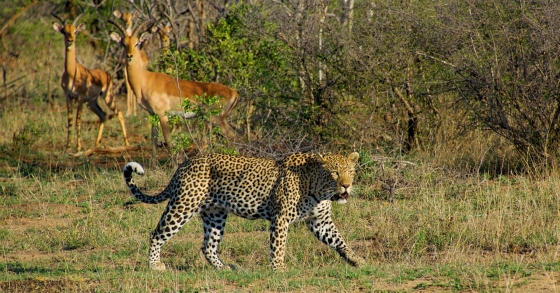
 Visit Kruger Park in South Africa
Are you going to South Africa, then you cannot skip the Kruger Park. The Kruger Park is one of the most beautiful and largest safari parks in the world.
When exploring climate, sunlight hours tell an important story. This page shows the total number of hours of direct sunlight per month and the average hours per day in Table View, Western Cape, South Africa. This average is based on long-term data collected between 1990 and 2020.
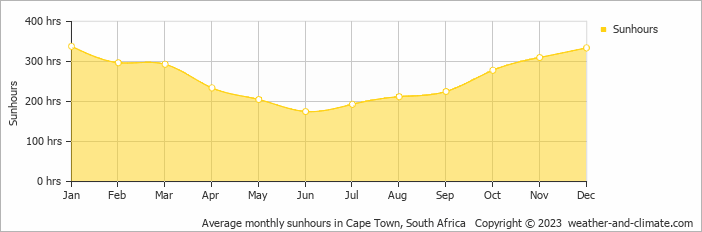
Seasonal sunshine in Table View varies. It peaks at 338 hours in January and drops to 175 hours in June. The total annual amount of sun is 3094 hours.
In Table View, summer days are longer and more sunny, with daily sunshine hours peaking at 11.3 hours in January. As the darker season arrives, the brightness of the sun becomes less. June sees a soft sun for only 5.8 hours per day.
Table View enjoys an average of 3094 hours of sunshine annually. Let’s compare this with some popular tourist destinations:
Athens, Greece, enjoys 2769 hours of sunshine each year, making it one of the sunniest destinations in the Mediterranean region.
In contrast, Brussels, Belgium, receives only about 1590 hours of sunshine per year, known for its frequently overcast and rainy skies.
In Shanghai, China, the annual average sunshine is 1780 hours, with cloudier weather in summer.
Adelaide, Australia, enjoys 2770 hours of sunshine annually, with long, sunny summers.
June, Table View’s wettest month, receives 15 mm (0.6 in) of rainfall and has a maximum daytime temperature of 18°C (64°F). During the driest month January you can expect a temperature of 26°C (79°F).
For more detailed insights into the city’s temperatures, check out our Temperature page. To explore more about precipitation patterns, visit our Table View Precipitation page.
Pick a month to see the average temperature, rainfall and sunshine in Table View - and find the best time to visit.
Temperature Rainfall Sunshine Humidity Wind Speed Water Temp
See the full Table View climate overview or explore weather in South Africa.
Where to go in October - average daytime high across popular destinations.
Need travel inspiration? Check out our bucket list articles and be inspired.
Visit Kruger Park in South Africa
Are you going to South Africa, then you cannot skip the Kruger Park. The Kruger Park is one of the most beautiful and largest safari parks in the world.
 One of South Africa's most spectacular private game reserves
Sabi Sand Game Reserve is one of South Africa's most spectacular private game reserves. The chance that you see the entire Big Five is high in winter (June - August).

 Warm Days, Cool Nights: 8 Destinations With the Perfect Day-Night Temperature
Prefer warm sunny days but cool evenings? Compare eight destinations with daytime temperatures of around 25–30°C, cooler nights, low rainfall and plenty of sunshine.
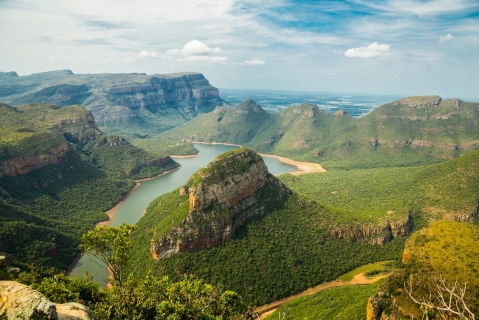 South Africa in November: Cape Town, Garden Route or East Coast?
Compare South Africa weather in November for Cape Town, Stellenbosch, Knysna, Durban and Johannesburg to find the driest and sunniest regions.