


















 Mud festival in South Korea
In July, the peaceful seaside town of Boryeong turned into a chaos of mud for 9 days. We recommend putting this festival on your bucket list.
In climate discussions, the hours of sunlight reveal much about a location. This page shows the total number of hours of direct sunlight per month and the average hours per day in Samgong, South Korea. The figures are based on a 30-year period (1990–2020) to provide a reliable average.
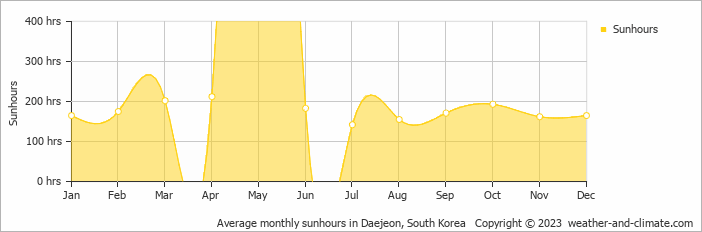
Across the seasons, sunshine hours in Samgong vary. From a high of 225 hours in May, to a low of 142 hours in July, the city offers a balanced mix of sunny and overcast days. The total annual sunshine amounts to 2150 hours.
The difference in daily sunshine hours between May (7.5 hours per day) and July (4.7 hours per day) offers moderate variety for visitors and residents.
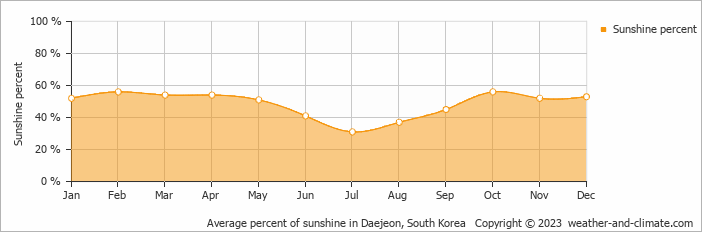
On average the sun shines 56% of the time during the day in February, the highest percentage of any month. July has the lowest percentage at 31%.
Samgong enjoys an average of 2150 hours of sunshine annually. Let’s compare this with some popular tourist destinations:
In Lisbon, Portugal, there are approximately 2801 hours of sunshine annually, highlighting its warm and sunny Mediterranean climate.
In contrast, Juneau, Alaska, receives only about 1523 hours of sunshine per year and is known for its very short days in winter and frequently overcast conditions.
Toronto, Canada, sees around 2071 hours of sunshine each year, with especially long, bright summer days.
Perth, Australia, enjoys 3180 hours of sunshine annually, the highest among major Australian cities.
July, Samgong’s wettest month, receives 224 mm (8.8 in) of rainfall and has a maximum daytime temperature of 29°C (84°F). During the driest month December you can expect a temperature of 6°C (43°F).
For more detailed insights into the city’s temperatures, check out our Temperature page. To explore more about precipitation patterns, visit our Samgong Precipitation page.
Pick a month to see the average temperature, rainfall and sunshine in Samgong - and find the best time to visit.
Temperature Rainfall Sunshine Humidity
See the full Samgong climate overview or explore weather in South Korea.
Where to go in October - average daytime high across popular destinations.
Need travel inspiration? Check out our bucket list articles and be inspired.
Mud festival in South Korea
In July, the peaceful seaside town of Boryeong turned into a chaos of mud for 9 days. We recommend putting this festival on your bucket list.
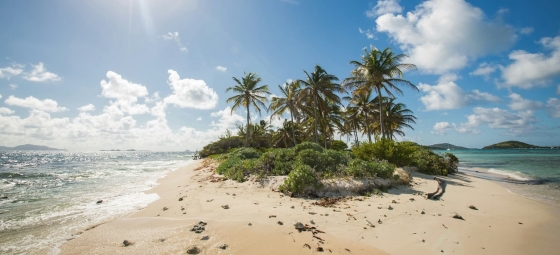
 10 Hidden gems in Asia you need to visit
Explore 10 hidden gems in Asia offering authentic experiences, from pristine beaches and remote islands to cultural treks and peaceful mountain villages.
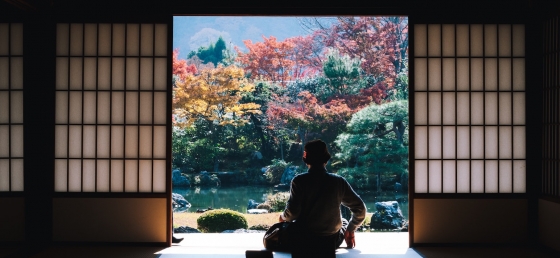
 Chase the autumn leaves in Japan
Japan is one of these cases which turns into a gold, yellow and orange fairy tale starting from September. And we can honestly say: We cannot imagine a more beautiful season to visit Japan.

 The 10 Most Exquisite Beaches in the Philippines
Explore the top 10 breathtaking beaches in the Philippines, from serene Nacpan Beach to volcanic Camiguin Island, in our detailed guide.