Gyeongju Weather & Climate: Best Time to Visit
Average temperatures, rainfall, sunshine and the best time to visit Gyeongju.
Climate overview of Gyeongju
Gyeongju, Gyeongsangbuk-Do, South Korea, sees big temperature differences between seasons, with August peaking at 31°C (88°F) and January dropping to 7°C (45°F).
With around 1164 mm (46 in) of annual rain/snowfall, Gyeongju has a notably wet climate. However, this rain/snowfall is not evenly distributed — the city has a distinct dry season from December to February. The wettest month is August. The most sunshine falls in May, with an average of 7.6 hours of daily sunshine.
Gyeongju Weather by Month
Pick a month to see the average temperature, rainfall and sunshine in Gyeongju — and find the best time to visit.
Monthly Temperature in Gyeongju
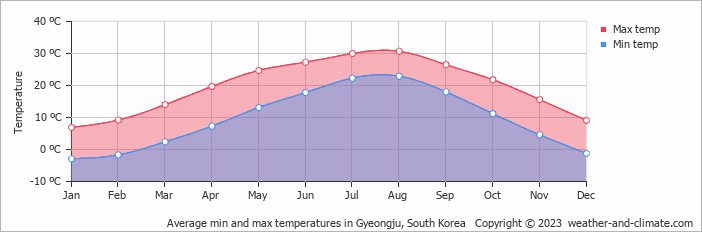
Visitors to Gyeongju can expect significant temperature changes throughout the year. Average daytime temperatures reach a very warm 31°C (88°F) in August. In January, the coolest month of the year, temperatures drop to a chilly 7°C (45°F).
At night, temperatures range from around 23°C (73°F) in August to -3°C (27°F) in January.
Check out our detailed temperature page for more information.
Temperature ranges by month
Rainfall in Gyeongju
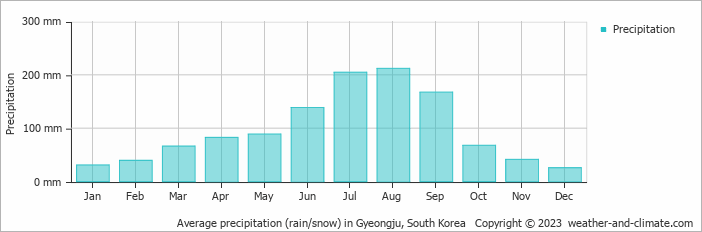
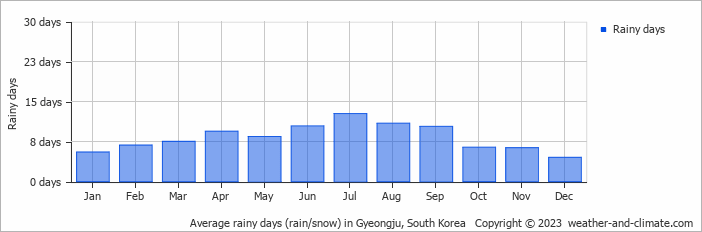
Gyeongju is known for its substantial rain/snowfall, with annual precipitation reaching 1164 mm (46 in). Gyeongju can be quite wet during August, receiving approximately 212 mm (8.3 in) of precipitation over 11 rainy days.
In contrast, during the driest month (December), you will experience much drier conditions, with 25 mm (1 in) of precipitation spread across 5 rainy days days. For more details, please visit our Gyeongju Precipitation page.
The mean monthly precipitation over the year, including rain, hail, and snow
The average number of days each month with precipitation
Sunshine Hours in Gyeongju
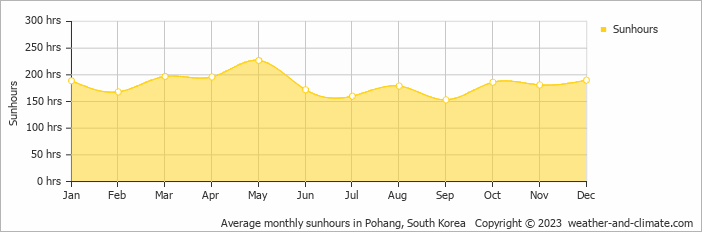
Gyeongju experiences moderate variation in sunshine hours across the seasons. With 7.6 hours daily sunshine in May, it dips to 5.1 hours in September, offering a balanced mix of sunny and overcast days.
Visit our detailed sunshine hours page for more information.
Monthly hours of sunshine
Daily hours of sunshine
Daily percentage of sunshine
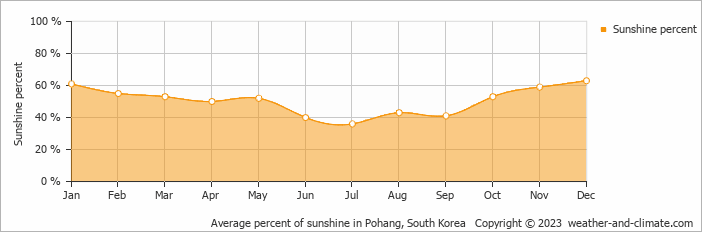
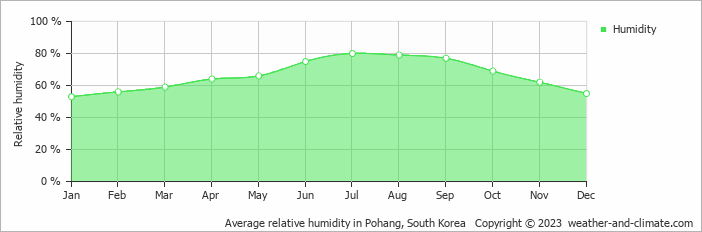
Humidity in Gyeongju by Month
The relative humidity is high throughout the year in Gyeongju.
The city experiences its highest humidity in July, reaching 80%. In January, the humidity drops to its lowest level at 53%. What does this mean? Read our detailed page on humidity levels for further details.
Relative humidity over the year
Best Time to Visit Gyeongju
The weather does bring rainfall during this period, between 68 mm (2.7 in) and 138 mm (5.4 in).
Plan accordingly for July, August and September, when conditions bring the heaviest precipitation. Wondering where to travel based on your weather preferences? Our recommendation tool helps you find destinations with your ideal climate conditions. Use our weather planner to find your perfect destination.
Frequently asked questions about the climate in Gyeongju
What is the best time to visit Gyeongju?
April, May and October typically offer the most optimal weather in Gyeongju. In contrast, January, February, July and August tend to have less optimal conditions. Gyeongju has a distinct dry season from December to February.
What temperatures can I expect in Gyeongju?
Daytime highs range from 7°C (45°F) in January to 31°C (88°F) in August. Nighttime lows range from -3°C (27°F) to 23°C (73°F). Temperatures vary considerably through the year.
How much rain does Gyeongju get?
Annual rainfall is around 1164 mm (46 in). August is the wettest month with 212 mm (8.3 in), while December is the driest with 25 mm (1 in).
How sunny is Gyeongju?
Gyeongju receives around 2,198 hours of sunshine per year. May is the sunniest month with 227 hours, while September is the cloudiest with just 153 hours. Overall, Gyeongju enjoys abundant sunshine.
Gyeongju 3-Day Forecast
Gyeongju 3-Day Forecast
Gyeongju on the map
Gyeongju is highlighted — select any city to see its climate.
Popular this month
Where to go in July — average daytime high across popular destinations.
Bucket list
Need travel inspiration? Check out our bucket list articles and be inspired.
