

















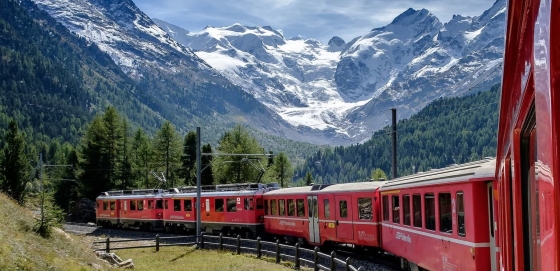
 The 5 most scenic train journeys in Switzerland
Explore Switzerland's top 5 train journeys, featuring breathtaking Alpine views and engineering marvels like the Glacier Express and Bernina Express.
To truly understand a climate, we must look at its sunshine. This page shows the total number of hours of direct sunlight per month and the average hours per day in Rougemont, Vaud, Switzerland. The numbers reflect climate data gathered over a 30-year period, from 1990 to 2020.
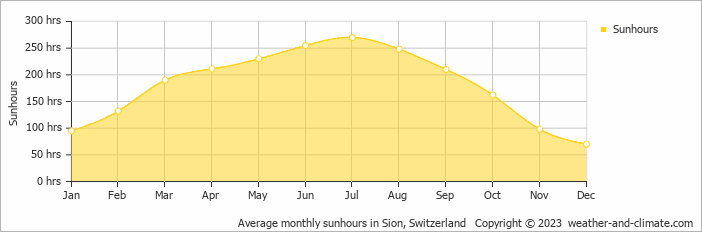
Sunshine in Rougemont varies greatly throughout the year. The sunniest month, July, reaches an impressive 270 hours, while December, the darkest month, offers only 70 hours. The total annual amount of sun is 2171 hours.
In Rougemont, summer days are longer and more sunny, with daily sunshine hours peaking at 9.0 hours in July. As the darker season arrives, the brightness of the sun becomes less. December sees a soft sun for only 2.3 hours per day.
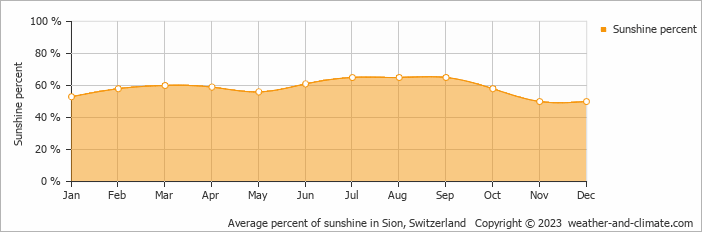
On average the sun shines 65% of the time during the day in August, the highest percentage of any month. December has the lowest percentage at 50%.
Rougemont enjoys an average of 2171 hours of sunshine annually. Let’s compare this with some popular tourist destinations:
Athens, Greece, enjoys 2769 hours of sunshine each year, making it one of the sunniest destinations in the Mediterranean region.
In contrast, London, UK, receives only about 1659 hours of sunshine per year, known for its frequently overcast and rainy skies.
Vancouver, Canada, receives approximately 1940 hours of sunshine annually.
Perth, Australia, enjoys 3180 hours of sunshine annually, the highest among major Australian cities.
July, Rougemont’s wettest month, receives 199 mm (7.8 in) of rainfall and has a maximum daytime temperature of 21°C (70°F). During the driest month October you can expect a temperature of 12°C (54°F).
For more detailed insights into the city’s temperatures, check out our Temperature page. To explore more about precipitation patterns, visit our Rougemont Precipitation page.
Pick a month to see the average temperature, rainfall and sunshine in Rougemont - and find the best time to visit.
Temperature Rainfall Sunshine Humidity
See the full Rougemont climate overview or explore weather in Switzerland.
Where to go in September - average daytime high across popular destinations.
Zürich 20°C (68°F) Crans-Montana15°C (59°F) Engelberg
 15°C (59°F) Nendaz15°C (59°F) Saas-Fee12°C (54°F) Davos13°C (55°F) Grindelwald13°C (55°F) Zermatt11°C (52°F)
 Need travel inspiration? Check out our bucket list articles and be inspired.
The 5 most scenic train journeys in Switzerland
Explore Switzerland's top 5 train journeys, featuring breathtaking Alpine views and engineering marvels like the Glacier Express and Bernina Express.
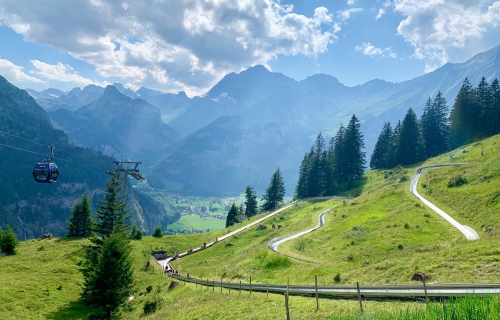 You'll love this Mountain roller coaster
Hotel Oeschinensee’s mountain coaster is a summer toboggan that you want to add to your bucket list. You'll get in your cart, sit down and fly across the track while enjoying the beautiful mountain scenery around you.
 The Verzasca Valley
You can visit the Verzasca Valley in any season. It's an amazing place for swimming and it is a paradise for hikers. A must see for the bucket list.
 Balloon at Chateau D'oex
If you are looking for a special place to visit in Europe in January we recommend visiting the annual balloon festival in Château-d'Oex, Switzerland.