Quixadá Weather & Climate: Best Time to Visit
Average temperatures, rainfall, sunshine and the best time to visit Quixadá.
Climate overview of Quixadá
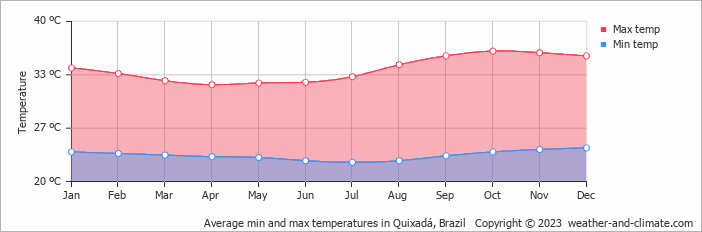
Quixadá, Ceará, Brazil, enjoys a steady climate throughout the year, with daytime temperatures typically around 34°C (93°F). October is the warmest month at 36°C (97°F), while April is the coolest at 32°C (90°F).
Annual rainfall is moderate at around 714 mm (28 in), with April being the wettest month. The city also has a distinct dry season from July to December.
Quixadá Weather by Month
Pick a month to see the average temperature, rainfall and sunshine in Quixadá - and find the best time to visit.


Monthly Temperature in Quixadá
The temperature in Quixadá remains steady throughout the year, providing a consistently very hot climate. Average daytime temperatures reach a very hot 36°C (97°F) in October. In April, the coolest month of the year, temperatures drop to a very warm 32°C (90°F).
At night, temperatures range from around 24°C (75°F) in October to 22°C (72°F) in April.
Check out our detailed temperature page for more information.
Temperature ranges by month
Rainfall in Quixadá
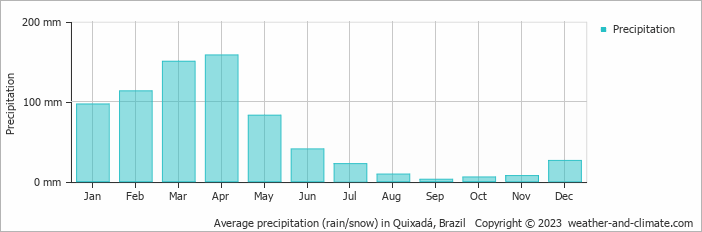
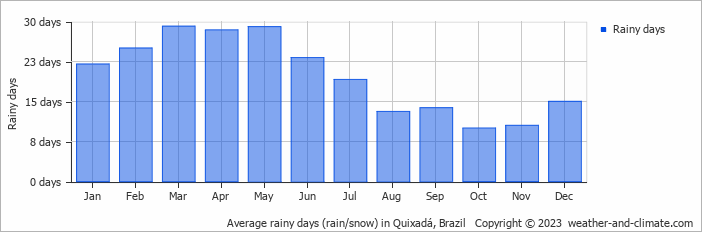
Generally, Quixadá has a moderate amount of precipitation, averaging 714 mm (28 in) of rainfall annually. Quixadá can be quite wet during April, receiving approximately 158 mm (6.2 in) of precipitation over 28 rainy days.
In contrast, during the driest month (September), you will experience much drier conditions, with 2.6 mm (0.1 in) of precipitation spread across 14 rainy days. For more details, please visit our Quixadá Precipitation page.
The mean monthly precipitation over the year, including rain, hail, and snow
The average number of days each month with precipitation
Best Time to Visit Quixadá
Monthly ratings reflect general weather comfort, based on daytime temperature and rainfall. Swimming and winter conditions are highlighted separately where relevant.
- Best overall: May, June and July
- Warmest weather: September, October, November and December
- Fewest rainy days: October and November
- Wettest months: January, February, March, April and May, when rainfall is highest.
- Seasonal pattern: A distinct dry season from July to December
Frequently asked questions about the climate in Quixadá
What is the best time to visit Quixadá?
May, June and July typically offer the most optimal weather in Quixadá. In contrast, January, February, March, August, September, October, November and December tend to have less optimal conditions. Quixadá has a distinct dry season from July to December.
What temperatures can I expect in Quixadá?
Daytime highs range from 32°C (90°F) in April to 36°C (97°F) in October. Nighttime lows range from 22°C (72°F) to 24°C (75°F). Temperatures stay relatively stable year-round.
How much rain does Quixadá get?
Annual rainfall is around 714 mm (28 in). April is the wettest month with 158 mm (6.2 in), while September is the driest with 2.6 mm (0.1 in).
Quixadá 3-Day Forecast
Quixadá on the map
Quixadá is highlighted - select any city to see its climate.
Popular this month
Where to go in August - average daytime high across popular destinations.


















Bucket list
Need travel inspiration? Check out our bucket list articles and be inspired.
 The 10 most alternative cities in South America
Discover South America's top 10 alternative cities! From Valparaíso's vibrant streets to La Paz's high-altitude charm and Medellín's innovative spirit.
 The 5 most tranquil retreats in the Amazon Rainforest, Brazil
Discover top sustainable lodges in the Amazon. Enjoy unique wildlife, eco-friendly stays, and immersive experiences at Anavilhanas, Cristalino, and more.
An alternative way to discover Rio de Janeiro
Don't feel like seeing the traditional tourist sights in Rio de Janeiro? We have made an overview of the sights in Rio de Janeiro that you must see if you want to visit Rio in an alternative way.
Iguazu Falls
Iguazu Falls are among the largest waterfalls on earth. You will be speechless when you see this miracle of mother nature. They are included in the World Heritage List and have also been named one of the seven wonders of the world.