Longyearbyen Sunshine Hours by Month
To truly understand a climate, we must look at its sunshine. This page shows the total number of hours of direct sunlight per month and the average hours per day in Longyearbyen, Svalbard, Norway. The numbers reflect climate data gathered over a 30-year period, from 1990 to 2020.
Monthly hours of sunshine
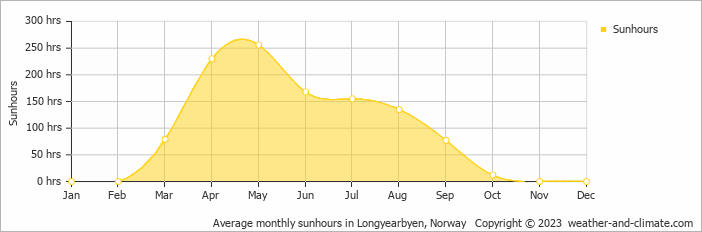
Seasonal sunshine in Longyearbyen varies. It peaks at 256 hours in May and drops to 0 hours in January. The total annual amount of sun is 1112 hours.
Daily hours of sunshine
This means the city can be enjoyed more throughout the sunniest month of May under a blue sky, with approximately 8.5 hours of sunshine daily. In contrast, the city experiences much darker days in January, with only 0.0 hours of sunlight per day.
Longyearbyen vs Major Cities: Sunshine Compared
Longyearbyen enjoys an average of 1112 hours of sunshine annually. Let’s compare this with some popular tourist destinations:
The city of Rome, Italy, experiences 2470 hours of sunshine annually, adding to its charm as a year-round tourist destination.
Manchester, UK, experiences just around 1420 hours of sunshine annually.
Boston, USA, enjoys 2629 hours of sunshine annually, with distinct seasons and many bright, sunny days.
In Tokyo, Japan, the average annual sunshine is 1930 hours, with sunny periods between rainy seasons.
Related Climate Data for Longyearbyen
November, Longyearbyen’s wettest month, receives 43 mm (1.7 in) of snowfall and has a maximum daytime temperature of -6°C (21°F). During the driest month June you can expect a temperature of 4°C (39°F).
For more detailed insights into the city’s temperatures, check out our Temperature page. To explore more about precipitation patterns, visit our Longyearbyen Precipitation page.