Kiltimagh Sunshine Hours by Month
In climate discussions, the hours of sunlight reveal much about a location. This page shows the total number of hours of direct sunlight per month and the average hours per day in Kiltimagh, Mayo, Ireland. The figures are based on a 30-year period (1990–2020) to provide a reliable average.
Monthly hours of sunshine
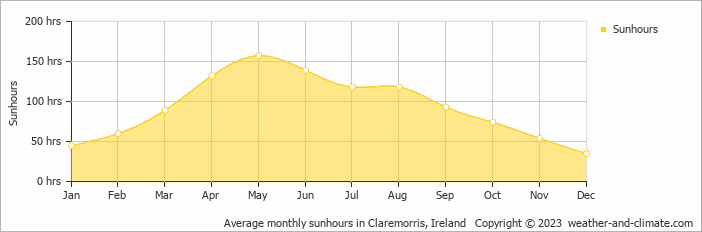
Those who love seasonal contrasts will appreciate Kiltimagh. Expect long, bright days with 157 hours in May and darker periods with just 35 hours in December. The total annual amount of sun is 1114 hours.
Daily hours of sunshine
For those who appreciate different seasons, Kiltimagh serves as an ideal destination. Expect longer, more sun-filled days in May with an average of 5.2 hours of sunshine daily, and embrace the darker days in December, offering only 1.2 hours of daily sunlight.
Average percent of sunshine
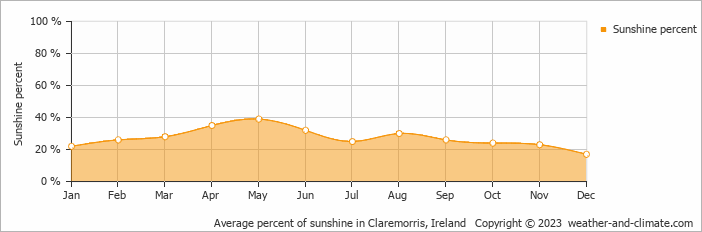
On average the sun shines 39% of the time during the day in May, the highest percentage of any month. December has the lowest percentage at 17%.
Kiltimagh vs Major Cities: Sunshine Compared
Kiltimagh enjoys an average of 1114 hours of sunshine annually. Let’s compare this with some popular tourist destinations:
Seville, Spain, enjoys an impressive 2920 hours of sunshine per year, making it an ideal destination even in winter.
In contrast, London, UK, receives only about 1659 hours of sunshine per year, known for its frequently overcast and rainy skies.
Beijing, China, has 2505 hours of sunshine annually, with clear, sunny days in winter.
Perth, Australia, enjoys 3180 hours of sunshine annually, the highest among major Australian cities.
Related Climate Data for Kiltimagh
December, Kiltimagh’s wettest month, receives 102 mm (4 in) of rainfall and has a maximum daytime temperature of 9°C (48°F). During the driest month April you can expect a temperature of 13°C (55°F).
For more detailed insights into the city’s temperatures, check out our Temperature page. To explore more about precipitation patterns, visit our Kiltimagh Precipitation page.