Cul de Sac Sunshine Hours by Month
To truly understand a climate, we must look at its sunshine. This page shows the total number of hours of direct sunlight per month and the average hours per day in Cul de Sac, Saint Martin. These values are calculated using 30 years of data (1990–2020) to ensure accuracy.
Monthly hours of sunshine
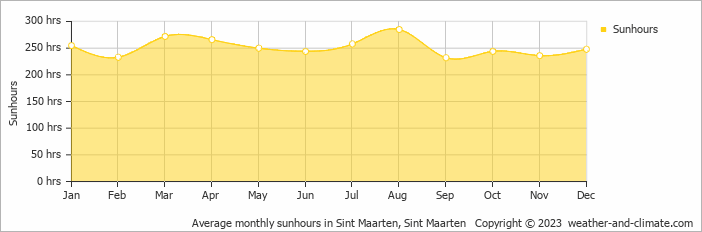
Year-round, Cul de Sac offers consistent sunshine. The difference between the sunniest month, August, with 285 hours, and September, the least sunny month, with 232, is minimal. The total annual sunshine amounts to 3023 hours.
Daily hours of sunshine
The sunniest days in Cul de Sac occur in August, with around 9.5 hours of daily sunshine. Even in September, the least sunny month, Cul de Sac doesn't shy away from the sun, still enjoying a comfortable 7.7 hours of daily sunlight.
Average percent of sunshine
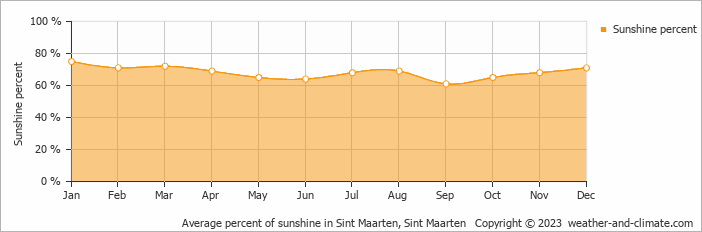
On average the sun shines 75% of the time during the day in January, the highest percentage of any month. September has the lowest percentage at 61%.
Cul de Sac vs Major Cities: Sunshine Compared
Cul de Sac enjoys an average of 3023 hours of sunshine annually. Let’s compare this with some popular tourist destinations:
The city of Rome, Italy, experiences 2470 hours of sunshine annually, adding to its charm as a year-round tourist destination.
In contrast, London, UK, receives only about 1659 hours of sunshine per year, known for its frequently overcast and rainy skies.
Boston, USA, enjoys 2629 hours of sunshine annually, with distinct seasons and many bright, sunny days.
In Brisbane, Australia, the annual sunshine averages 2999 hours, making it one of Australia’s sunniest cities.
Related Climate Data for Cul de Sac
October, Cul de Sac’s wettest month, receives 97 mm (3.8 in) of rainfall and has a maximum daytime temperature of 29°C (84°F). During the driest month March you can expect a temperature of 27°C (81°F).
For more detailed insights into the city’s temperatures, check out our Temperature page. To explore more about precipitation patterns, visit our Cul de Sac Precipitation page.
Cul de Sac Weather by Month
Pick a month to see the average temperature, rainfall and sunshine in Cul de Sac - and find the best time to visit.


Cul de Sac 3-Day Forecast
Temperature Rainfall Sunshine Humidity Wind Speed Water Temp
See the full Cul de Sac climate overview or explore weather in Saint Martin.
Popular this month
Where to go in September - average daytime high across popular destinations.
 Baie Longue
 30°C (86°F) Cul de Sac30°C (86°F) Marigot30°C (86°F) Grand Case30°C (86°F) Orient Bay French St Martin30°C (86°F) Les Terres Basses30°C (86°F) Baie Nettle30°C (86°F) Orient Bay30°C (86°F)













