Bumbang Sunshine Hours by Month
In climate discussions, the hours of sunlight reveal much about a location. This page shows the total number of hours of direct sunlight per month and the average hours per day in Bumbang, Lombok, Indonesia. Long-term data from 1990 to 2020 was used to calculate these averages.
Monthly hours of sunshine
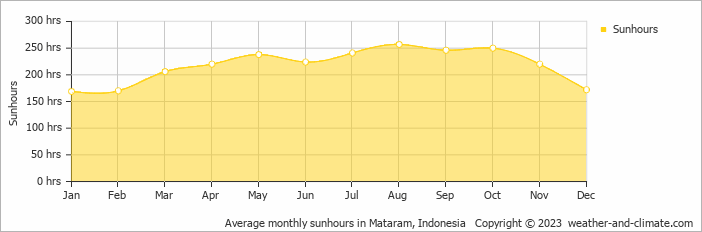
While the amount of sunshine in Bumbang changes moderately throughout the year, the annual total remains impressive at around 2613 hours. Expect slightly brighter days in August and a subtle dip in January.
Daily hours of sunshine
Enjoy up to 8.6 hours of daily sun in August, and experience slightly darker atmosphere in January, with about 5.6 hours of daily sunlight.
Bumbang vs Major Cities: Sunshine Compared
Bumbang enjoys an average of 2613 hours of sunshine annually. Let’s compare this with some popular tourist destinations:
In Barcelona, Spain, there are 2530 hours of sunshine annually and is a city that can be visited year-round.
In contrast, Juneau, Alaska, receives only about 1523 hours of sunshine per year and is known for its very short days in winter and frequently overcast conditions.
Toronto, Canada, sees around 2071 hours of sunshine each year, with especially long, bright summer days.
In Brisbane, Australia, the annual sunshine averages 2999 hours, making it one of Australia’s sunniest cities.
Related Climate Data for Bumbang
January, Bumbang’s wettest month, receives 156 mm (6.1 in) of rainfall and has a maximum daytime temperature of 31°C (88°F). During the driest month August you can expect a temperature of 29°C (84°F).
For more detailed insights into the city’s temperatures, check out our Temperature page. To explore more about precipitation patterns, visit our Bumbang Precipitation page.


