Sunshine Coast Sunshine Hours by Month
Sunshine is key to understanding how a place experiences its seasons. This page shows the total number of hours of direct sunlight per month and the average hours per day in Sunshine Coast, Australia. These averages rely on historical data collected over 30 years, from 1990 to 2020.
Monthly hours of sunshine
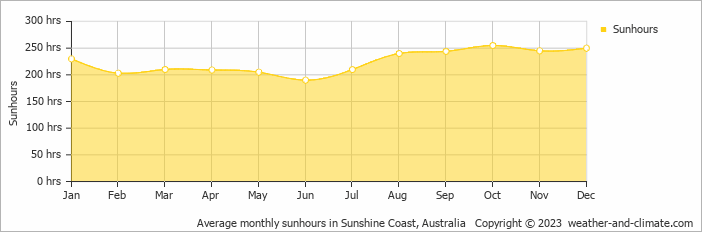
Sunshine Coast experiences sunny spells throughout the year. The sunniest month, October, sees up to 255 hours of sunshine, while June, the least sunny month, still provides a respectable 190 hours. The total annual sunshine amounts to 2691 hours.
Daily hours of sunshine
The difference in daily sunshine hours between October (8.5 hours per day) and June (6.3 hours per day) offers moderate variety for visitors and residents.
Sunshine Coast vs Major Cities: Sunshine Compared
Sunshine Coast enjoys an average of 2691 hours of sunshine annually. Let’s compare this with some popular tourist destinations:
The city of Rome, Italy, experiences 2470 hours of sunshine annually, adding to its charm as a year-round tourist destination.
In contrast, Brussels, Belgium, receives only about 1590 hours of sunshine per year, known for its frequently overcast and rainy skies.
Stockholm, Sweden, receives approximately 1907 hours of sunshine annually.
Perth, Australia, enjoys 3180 hours of sunshine annually, the highest among major Australian cities.
Related Climate Data for Sunshine Coast
February, Sunshine Coast’s wettest month, receives 112 mm (4.4 in) of rainfall and has a maximum daytime temperature of 31°C (88°F). During the driest month July you can expect a temperature of 23°C (73°F).
For more detailed insights into the city’s temperatures, check out our Temperature page. To explore more about precipitation patterns, visit our Sunshine Coast Precipitation page.


