

















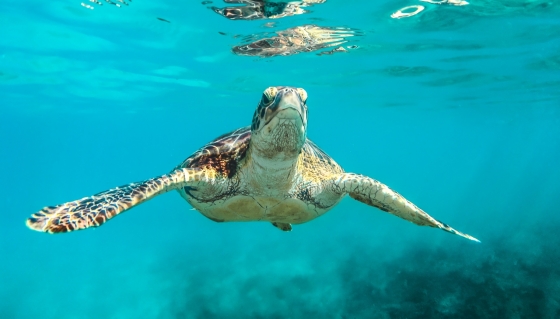
 Spot turtles in Oman
Oman is one of the countries with the most important turtle beaches in the world. April to June offers the best weather and plenty of Turtles.
Sunshine plays a big role in understanding the climate of a city. This page shows the total number of hours of direct sunlight per month and the average hours per day in Masirah Island, Oman. Long-term data from 1990 to 2020 was used to calculate these averages.
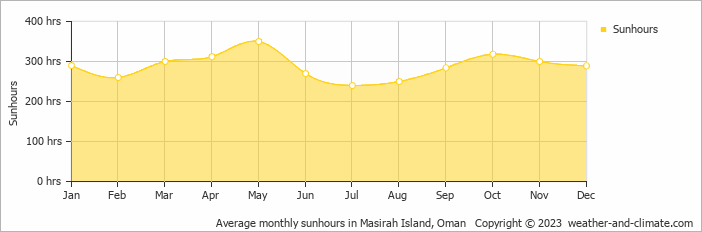
While the amount of sunshine in Masirah Island changes moderately throughout the year, the annual total remains impressive at around 3463 hours. Expect slightly brighter days in May and a subtle dip in July.
This means you can enjoy sunny spells year-round. May sees up to 11.7 hours of daily sunshine, perfect for a sunny trip. July, the least sunny month, still offers a generous 8.0 hours of sun despite this cloudier / rainier time of the year.
Masirah Island enjoys an average of 3463 hours of sunshine annually. Let’s compare this with some popular tourist destinations:
Seville, Spain, enjoys an impressive 2920 hours of sunshine per year, making it an ideal destination even in winter.
In contrast, Brussels, Belgium, receives only about 1590 hours of sunshine per year, known for its frequently overcast and rainy skies.
Stockholm, Sweden, receives approximately 1907 hours of sunshine annually.
Adelaide, Australia, enjoys 2770 hours of sunshine annually, with long, sunny summers.
June, Masirah Island’s wettest month, receives 0.5 mm (0.02 in) of rainfall and has a maximum daytime temperature of 30°C (86°F). During the driest month May you can expect a temperature of 30°C (86°F).
For more detailed insights into the city’s temperatures, check out our Temperature page. To explore more about precipitation patterns, visit our Masirah Island Precipitation page.
Pick a month to see the average temperature, rainfall and sunshine in Masirah Island - and find the best time to visit.
Temperature Rainfall Sunshine Humidity
See the full Masirah Island climate overview or explore weather in Oman.
Where to go in September - average daytime high across popular destinations.
Need travel inspiration? Check out our bucket list articles and be inspired.
Spot turtles in Oman
Oman is one of the countries with the most important turtle beaches in the world. April to June offers the best weather and plenty of Turtles.
 Stargaze at the Sharqiya Sands
The Sharqiya Sands (formerly known as Wahiba Sands) is a desert how you imagine a desert to be. An almost uninhabited strip of sand with towering endless dunes that have been formed by the wind into perfectly rounded hills.
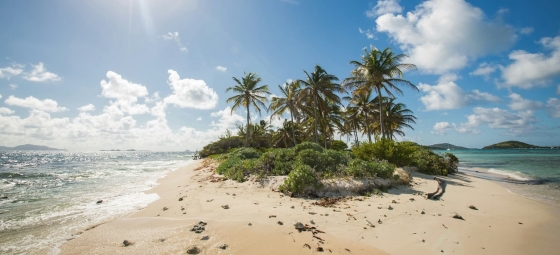
 10 Hidden gems in Asia you need to visit
Explore 10 hidden gems in Asia offering authentic experiences, from pristine beaches and remote islands to cultural treks and peaceful mountain villages.
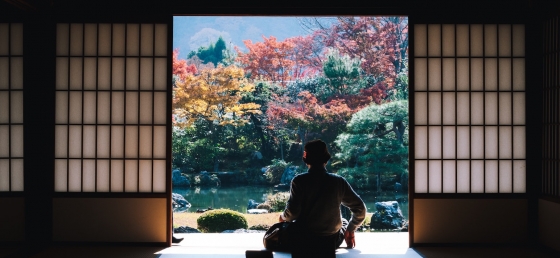
 Chase the autumn leaves in Japan
Japan is one of these cases which turns into a gold, yellow and orange fairy tale starting from September. And we can honestly say: We cannot imagine a more beautiful season to visit Japan.