Average monthly wind speed in Vinkel
On this page you will find more information about the mean monthly wind speed over the year in Vinkel (Noord-Brabant), the Netherlands.
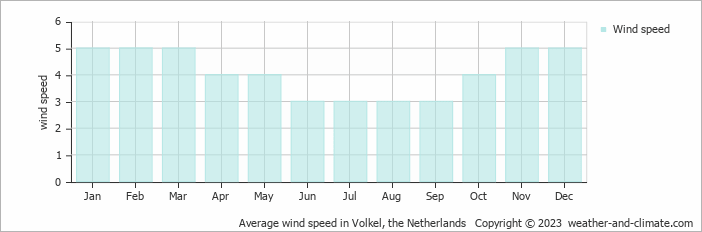
Throughout the year, wind speeds in Vinkel average from 3 m/s (6 knots) and increase to 5 m/s (10 knots).
The 3 m/s (6 knots) average wind speed in June, July, August and September brings moderate air movement. Conditions can vary throughout the month, with some days experiencing stronger winds and others remaining calm. At this average speed, leaves and small branches move steadily, and flags show continuous motion. This equates to about 11 kilometers per hour or 6.7 miles per hour.
Wind speeds average 5 m/s (10 knots) during January, February, March, November and December, making these the windiest months of the year. Most days bring strong winds that can sway small trees and make walking more challenging. Umbrellas are difficult to manage. The average speed of 5 m/s equals 18 km/h or 11.2 mph. While calmer intervals or stronger gusts may occur, breezy conditions are typical throughout this period. It's generally a great time for flying a kite or going windsurfing.
For more detailed information about Vinkel’s weather, including monthly rainfall, sunshine hours, and humidity levels, visit our Vinkel climate page.


