
















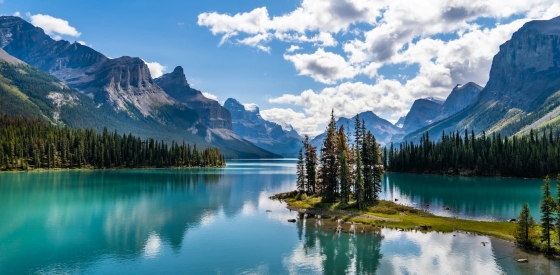
 The 5 most beautiful lakes in Canada
Explore Canada's stunning lakes: Lake Louise, Lake Superior, Maligne Lake, Emerald Lake, and Lake Okanagan, each offering unique beauty and activities.
On this page you will find more information about the mean monthly wind speed over the year in Verdun (), Canada.
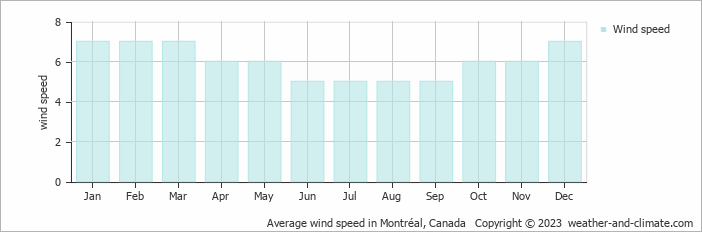
The average annual wind speed in Verdun spans from 5 m/s (10 knots) to 7 m/s (14 knots).
An average wind speed of 5 m/s (10 knots) in June, July, August and September means the wind is quite constant and noticeable for much of the month. There may still be stronger gusts or calmer moments, but windy conditions are the norm. Larger branches would start swaying, and dust, leaves, and small objects would often blow around.
For outdoor activities, you’d likely feel the wind frequently pushing against you. It could make, for example, running or cycling more tiring. Still, it's not so strong that it becomes uncomfortable. The average speed is around 18 km/h or 11 mph. At this speed, wind- and kitesurfing become very enjoyable.
Wind speeds average [7 m/s] in January, February, March and December, making these the windiest months of the year. Many days have strong, persistent breezes, and gusts can occasionally reach higher levels.
For more detailed information about Verdun’s weather, including monthly rainfall, sunshine hours, and humidity levels, visit our Verdun climate page.
Pick a month to see the average temperature, rainfall and sunshine in Verdun - and find the best time to visit.
Temperature Rainfall Sunshine Humidity Wind Speed Water Temp
See the full Verdun climate overview or explore weather in Canada.
Where to go in September - average daytime high across popular destinations.
Toronto 22°C (72°F) Niagara Falls23°C (73°F) Montréal
 22°C (72°F) Ottawa22°C (72°F) Quebec City
 20°C (68°F) Vancouver19°C (66°F) Calgary19°C (66°F) Whistler15°C (59°F)
 Need travel inspiration? Check out our bucket list articles and be inspired.
The 5 most beautiful lakes in Canada
Explore Canada's stunning lakes: Lake Louise, Lake Superior, Maligne Lake, Emerald Lake, and Lake Okanagan, each offering unique beauty and activities.
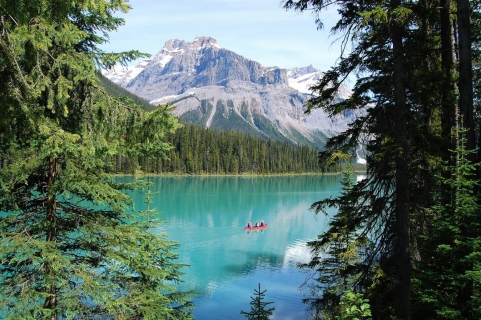 Canada in September: Where Is the Best Weather?
Compare September weather in Toronto, Montreal, Vancouver, Quebec City and Osoyoos to find Canada's warmest, driest and sunniest destinations.
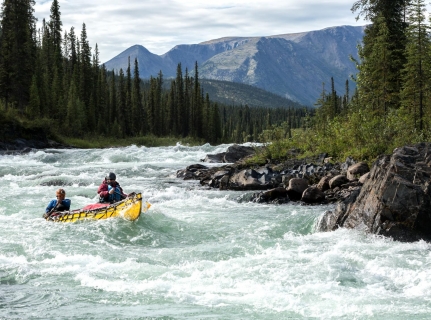 Canoeing the south Nahannii
The South Nahanni in the northwest of Canada is one of the most impressive wilderness rivers in the world. Canoeing the south Nahanni is something you must add to your bucket list.
 See Polar Bears in Churchill Canada
Thousands of bears gather at the small town of Churchill. In the evening the northern lights give a light show against the dark evening sky. An unforgettable experience.