
















 The 5 most beautiful lakes in Canada
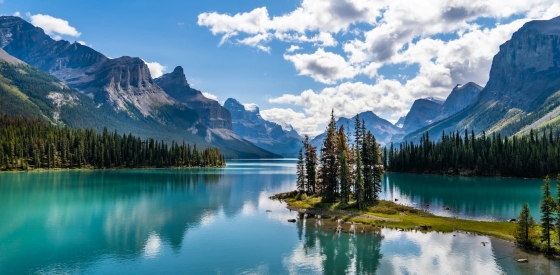
Explore Canada's stunning lakes: Lake Louise, Lake Superior, Maligne Lake, Emerald Lake, and Lake Okanagan, each offering unique beauty and activities.
The mean monthly wind speed over the year in Terrebonne (Quebec), Canada.
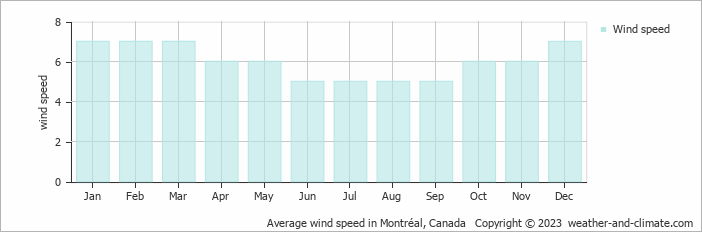
Annually, wind speeds in Terrebonne vary between 5 m/s (10 knots) at their lowest and 7 m/s (14 knots) at their peak.
June, July, August and September brings a 5 m/s (10 knots) wind speed average, establishing consistent and prominent air movement throughout the period. While daily variations include both stronger and calmer periods, active wind conditions dominate most days. Large tree branches exhibit regular swaying, and loose materials like dust and leaves frequently move about.
When engaging in physical activities, you'll notice persistent wind resistance that can increase effort levels for running or cycling. Despite this resistance, the conditions remain manageable and comfortable. This speed equals 18 kilometers per hour or 11 miles per hour, creating excellent conditions for wind sports like windsurfing.
The windiest period, January, February, March and December has average wind speeds of 7 m/s (14 knots). This means typical days feature strong gusts that create resistance when walking and make large trees sway noticeably. Wind becomes a constant factor. The speed translates to 25.2 kilometers per hour or 15.7 miles per hour. While intensity varies throughout the day, consistently strong winds are the norm.
For more detailed information about Terrebonne’s weather, including monthly rainfall, sunshine hours, and humidity levels, visit our Terrebonne climate page.
Pick a month to see the average temperature, rainfall and sunshine in Terrebonne - and find the best time to visit.
Temperature Rainfall Sunshine Humidity Wind Speed Water Temp
See the full Terrebonne climate overview or explore weather in Canada.
Where to go in October - average daytime high across popular destinations.
Toronto 16°C (61°F) Niagara Falls15°C (59°F) Montréal14°C (57°F) Ottawa14°C (57°F) Vancouver
 14°C (57°F) Quebec City12°C (54°F) Calgary
 12°C (54°F) Whistler7°C (45°F)
 Need travel inspiration? Check out our bucket list articles and be inspired.
The 5 most beautiful lakes in Canada
Explore Canada's stunning lakes: Lake Louise, Lake Superior, Maligne Lake, Emerald Lake, and Lake Okanagan, each offering unique beauty and activities.
 Canada in September: Where Is the Best Weather?
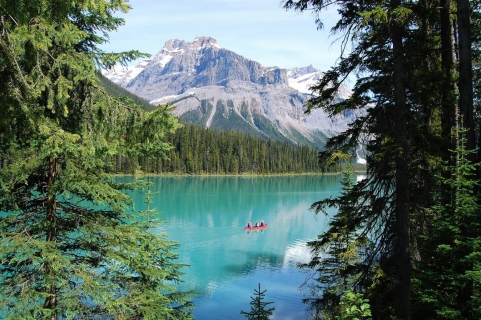
Compare September weather in Toronto, Montreal, Vancouver, Quebec City and Osoyoos to find Canada's warmest, driest and sunniest destinations.
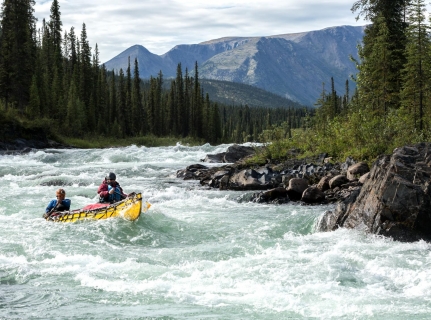 Canoeing the south Nahannii
The South Nahanni in the northwest of Canada is one of the most impressive wilderness rivers in the world. Canoeing the south Nahanni is something you must add to your bucket list.
 See Polar Bears in Churchill Canada
Thousands of bears gather at the small town of Churchill. In the evening the northern lights give a light show against the dark evening sky. An unforgettable experience.