

















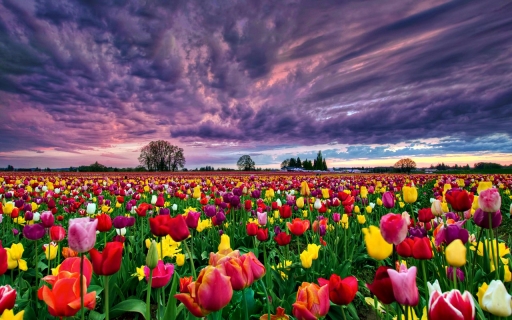
 Flower fields in the Netherlands
The flower fields in The Netherlands are world famous. The red, pink and yellow colors are breathtakingly beautiful and should be on the bucket list.
The mean monthly wind speed over the year in Geldrop (Noord-Brabant), the Netherlands.
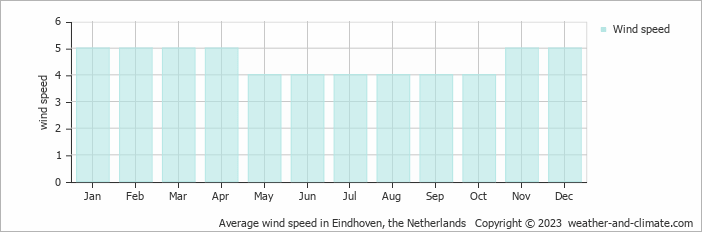
These figures come from monthly climatological averages showing that Geldrop sees peak wind speeds of 5 m/s (10 knots) during its windiest period and minimum speeds of 4 m/s (8 knots) during its calmest season.
The 4 m/s (8 knots) average in May, June, July, August, September and October means Geldrop experiences consistent moderate winds. Conditions vary from calm periods around to more active episodes throughout the month. At typical wind levels, smaller trees show steady branch movement. In common units, 4 m/s (8 knots) equals 14.4 km/h or 8.9 mph. While generally comfortable for most activities, occasional windy days may affect your plans and can make the air feel cooler.
Wind speeds average 5 m/s (10 knots) in , marking the windiest months of the year. The air is often steady and noticeable throughout the month, though occasional stronger gusts or brief calms may occur. Windy conditions are typical during this period, making it a great time for activities like windsurfing and kitesurfing.
For more detailed information about Geldrop’s weather, including monthly rainfall, sunshine hours, and humidity levels, visit our Geldrop climate page.
Pick a month to see the average temperature, rainfall and sunshine in Geldrop - and find the best time to visit.
Temperature Rainfall Sunshine Humidity Wind Speed
See the full Geldrop climate overview or explore weather in the Netherlands.
Where to go in October - average daytime high across popular destinations.
Noordwijk aan Zee 15°C (59°F) Valkenburg15°C (59°F) Utrecht15°C (59°F) Maastricht16°C (61°F) Rotterdam16°C (61°F) Zandvoort
 15°C (59°F) The Hague16°C (61°F) Amsterdam15°C (59°F)
 Need travel inspiration? Check out our bucket list articles and be inspired.
Flower fields in the Netherlands
The flower fields in The Netherlands are world famous. The red, pink and yellow colors are breathtakingly beautiful and should be on the bucket list.
 Pride in Amsterdam
Nowhere in the world is Pride being celebrated on the water on such a scale as in Amsterdam. It is an unique experience that every person needs to add to his, her or its bucket list.
 The greenest experience of Amsterdam
If you’re looking for an experience of Amsterdam that is rooted in nature, that can help you go outside and get your hands dirty, then these tips are for you.
 Amsterdam Dance Event
ADE is one of the larger festival giants, but you may never have heard of it if you are not an electronic music fan. It last five days and takes place in October.