















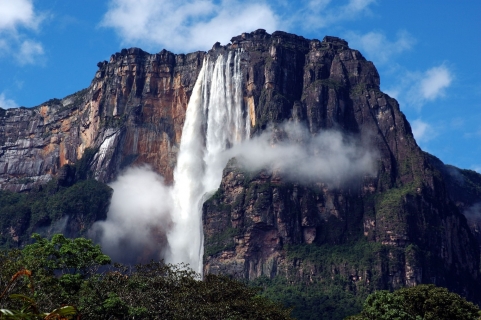
 Visit Angel Falls
There are many Waterfalls in South Amerika to visit, however The Angel Falls is a waterfall like no other. This world heritage park needs to undoubtedly be on your bucket list.
On this page you will find more information about the mean monthly wind speed over the year in Caraballeda (), Venezuela.
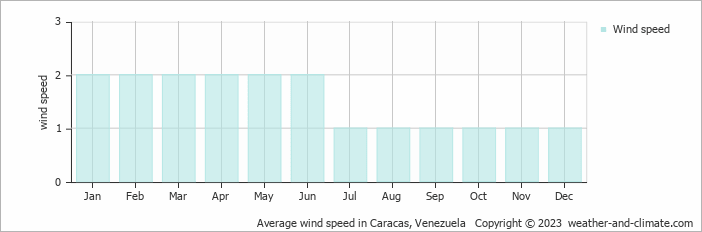
Annually, wind speeds in Caraballeda vary between 1 m/s (2 knots) at their lowest and 2 m/s (4 knots) at their peak.
The 1 m/s (2 knots) average in July, August, September, October, November and December means predominantly still conditions throughout the month. Some days will be completely calm while others may experience a bit more wind. In general this minimal wind speed is barely perceptible on skin. In terms of speed conversion, it represents 3.6 kilometers per hour or 2.2 miles per hour.
The Beaufort scale categorizes this as "light air." Smoke patterns show nearly vertical rise with slight occasional drift. Tree leaves remain generally undisturbed, with only rare gentle rustling. Wind becomes a non-factor for most activities during these tranquil months.
Wind speeds reach an average of 2 m/s (4 knots) in January, February, March, April, May and June. This means that on some days, the air is nearly still. There could also be gusts of up to 4 m/s (8 knots) on other days.
For more detailed information about Caraballeda’s weather, including monthly rainfall, sunshine hours, and humidity levels, visit our Caraballeda climate page.
Pick a month to see the average temperature, rainfall and sunshine in Caraballeda - and find the best time to visit.
Temperature Rainfall Sunshine Humidity Wind Speed Water Temp
See the full Caraballeda climate overview or explore weather in Venezuela.
Where to go in September - average daytime high across popular destinations.
Coro 34°C (93°F) Cuidad Bolivar
 34°C (93°F) Guanare
 33°C (91°F) Guasdualito32°C (90°F) Caraballeda30°C (86°F) Barquisimeto
 31°C (88°F) Caracas31°C (88°F) Isla De Aves30°C (86°F)
 Need travel inspiration? Check out our bucket list articles and be inspired.
Visit Angel Falls
There are many Waterfalls in South Amerika to visit, however The Angel Falls is a waterfall like no other. This world heritage park needs to undoubtedly be on your bucket list.
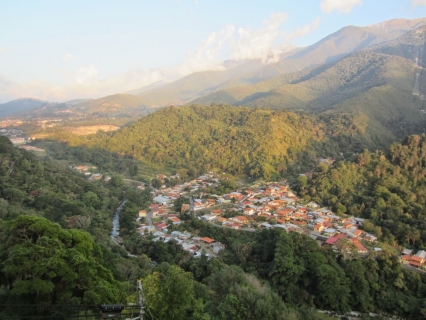 Go to Merida in Venezuela
Mérida is a laidback backpacker city and is full of students. The university city is the cultural center of the Andes and with a special location at 1700 meters a must for every traveler.

 Mount Roraima is one of the most spectacular treks in Latin America
Mount Roraima, the feeling is indescribable. This is where the world seems to stop. As if you are on the roof of the world. Something you need to add to the bucket list.

 Visit the Rainbow Mountains
The Rainbow Mountain (Vinicunca) is acolored rainbow mountain that will steal your heart forever and the view from the top will take your breath away.