













 10 Hidden gems in Asia you need to visit
Explore 10 hidden gems in Asia offering authentic experiences, from pristine beaches and remote islands to cultural treks and peaceful mountain villages.
On this page you will find more information about the mean monthly wind speed over the year in Ban Xianglôm (), Laos.
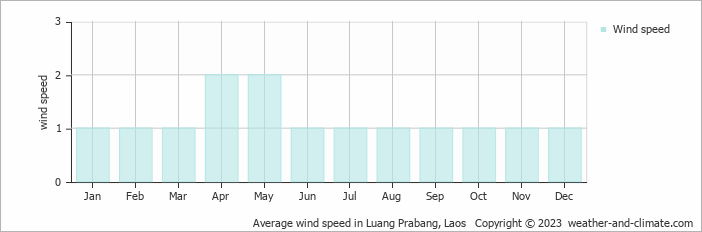
Wind speed in Ban Xianglôm varies across the year, ranging from 1 m/s (2 knots) to 2 m/s (4 knots).
With an average of 1 m/s (2 knots) during January, February, March, June, July, August, September, October, November and December, the air remains quite still most of the time. Daily variations range from completely calm periods to gentle breezes reaching 3 m/s (6 knots). At this low average, you'll barely notice air movement against your face. Converting to other units, this equals 3.6 km/h or 2.2 mph.
Weather experts classify this as "light air" on the Beaufort scale. Smoke from chimneys rises almost straight up with minimal drift. Leaves typically stay motionless, though occasional light stirring may occur. These conditions create a relaxed atmosphere where wind seldom interferes with plans or comfort.Wind speeds average 2 m/s (4 knots) during April and May. This means most days have light air movement that you can feel on your face. Flags move slightly and smoke drifts at an angle. The measurement represents 7.2 km/h or 4.5 mph. Some days are nearly calm while others have a bit stronger breezes.
For more detailed information about Ban Xianglôm’s weather, including monthly rainfall, sunshine hours, and humidity levels, visit our Ban Xianglôm climate page.
Pick a month to see the average temperature, rainfall and sunshine in Ban Xianglôm - and find the best time to visit.
Temperature Rainfall Sunshine Humidity Wind Speed
See the full Ban Xianglôm climate overview or explore weather in Laos.
Where to go in October - average daytime high across popular destinations.
 Thakhek
 32°C (90°F) Ban Dondét
 33°C (91°F) Vientiane33°C (91°F) Savannakhet
 32°C (90°F) Pakse31°C (88°F) Vang Vieng
 30°C (86°F) Luang Prabang
 30°C (86°F) Louang Namtha29°C (84°F)
 Need travel inspiration? Check out our bucket list articles and be inspired.
10 Hidden gems in Asia you need to visit
Explore 10 hidden gems in Asia offering authentic experiences, from pristine beaches and remote islands to cultural treks and peaceful mountain villages.
 Top 5 sacred sites in Laos
Explore Laos's spiritual heritage with our guide to the top 5 sacred sites, from mystic temples to Buddha-filled caves.
 Wat Phou: Ancient Khmer Temples in Southern Laos
The ancient Khmer temples of Wat Phou in Laos: stunning views, rich history, a unique journey along the Mekong River. Best time to visit: Nov–Feb.

 Chase the autumn leaves in Japan
Japan is one of these cases which turns into a gold, yellow and orange fairy tale starting from September. And we can honestly say: We cannot imagine a more beautiful season to visit Japan.