















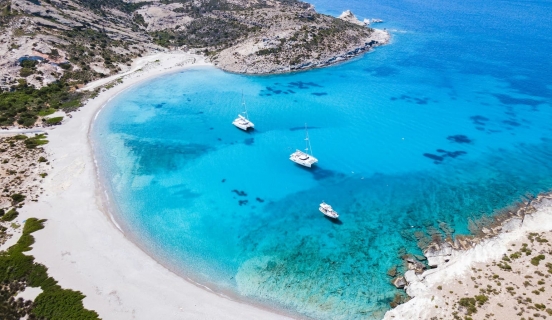
 Top 5 secluded beaches in Greece
Explore Greece's hidden gems: secluded beaches like Fokos, Seychelles, Potami, Kedrodasos, and Mouros for tranquil adventures away from crowds.
Average temperatures, rainfall, sunshine and the best time to visit Yírion.
 –
–
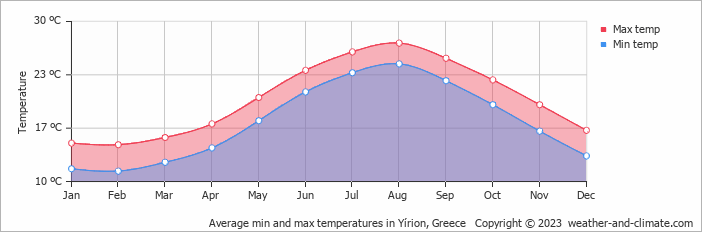
Temperatures in Yírion, Greece, vary greatly throughout the year. August is the hottest month at 27°C (81°F), while February is the coldest at 15°C (59°F).
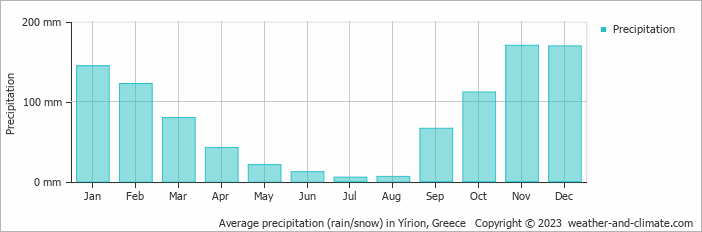
With around 950 mm (37 in) of annual rainfall, the city has moderate precipitation levels. November is the wettest month and July the driest. It also has a distinct dry season from May to August, with warm summers and mild winters.
Pick a month to see the average temperature, rainfall and sunshine in Yírion - and find the best time to visit.
The climate in Yírion is known for significant temperature differences throughout the year, making the weather dynamic. Typically, average maximum daytime temperatures range from a comfortable 27°C (81°F) in August to a moderate 15°C (59°F) in the coolest month, February.
Nights vary from 25°C (77°F) in August to around 11°C (52°F) during the colder months.
Check out our detailed temperature page for more information.
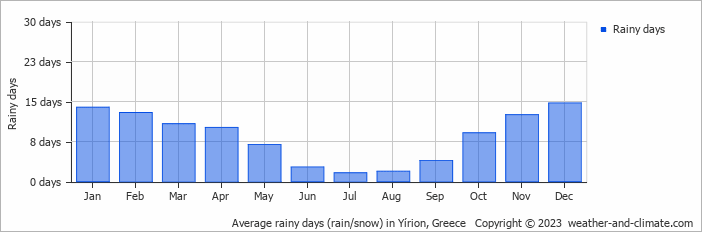
Generally, Yírion receives mid-range precipitation levels, with 950 mm (37 in) annually. The climate in Yírion shows significant variation throughout the year. Expect heavy rainfall in November, the wettest month, with an average of 170 mm (6.7 in) of precipitation over 13 rainy days.
In contrast, the driest month July offers drier and sunnier days, with around 5.2 mm (0.2 in) of rainfall over 2 rainy days. For more details, please visit our Yírion Precipitation page.
Monthly ratings reflect general weather comfort, based on daytime temperature and rainfall. Swimming and winter conditions are highlighted separately where relevant.
May, June, July, August and September typically offer the most optimal weather in Yírion. In contrast, January, February and December tend to have less optimal conditions. Yírion has a distinct dry season from May to August, with warm summers and mild winters.
Daytime highs range from 15°C (59°F) in February to 27°C (81°F) in August. Nighttime lows range from 11°C (52°F) to 25°C (77°F). Temperatures vary considerably through the year.
Annual rainfall is around 950 mm (37 in). November is the wettest month with 170 mm (6.7 in), while July is the driest with 5.2 mm (0.2 in).
Yírion is highlighted - select any city to see its climate.
Where to go in October - average daytime high across popular destinations.
Athens 25°C (77°F) Hersonissos25°C (77°F) Naxos Chora22°C (72°F) Oía23°C (73°F) Fira23°C (73°F) Mýkonos City22°C (72°F) Kalambaka
 21°C (70°F) Chania Town22°C (72°F)
 Need travel inspiration? Check out our bucket list articles and be inspired.
Top 5 secluded beaches in Greece
Explore Greece's hidden gems: secluded beaches like Fokos, Seychelles, Potami, Kedrodasos, and Mouros for tranquil adventures away from crowds.
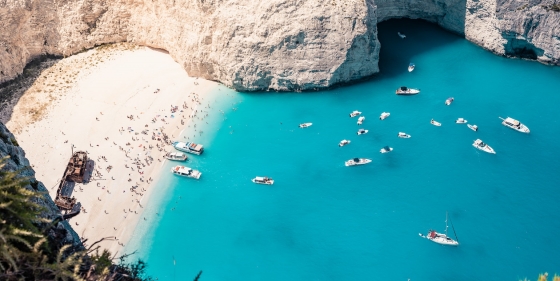 Discover Zakynthos
On the Greek island you can discover the rugged coastline, authentic old villages, a beautiful interior and the caves with the beautiful azure water.
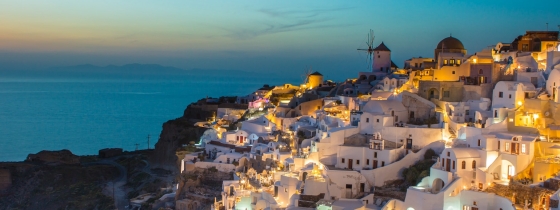 Why Santorini should be on every Bucket List
This Greek island is home to some of the most stunning scenery globally, with its beautiful Caldera views, white-washed houses and crystal-clear waters.

 The 10 most charming villages in France
Discover France's top 10 beautiful villages. From Normandy to the Côte d'Azur, experience quaint squares and cobbled streets. Which one will you visit this summer?