















 Warm Sea Without Extreme Heat: 8 Beach Destinations With Comfortable Weather
Love warm seawater but not extreme heat? Compare eight beach destinations where the sea stays warm while daytime temperatures remain comfortable.
Average temperatures, rainfall, sunshine and the best time to visit Xalapa.
 –
–
Xalapa, Veracruz experiences a subtropical highland climate with stable temperatures throughout the year. The comfortable weather makes it ideal for strolling through the vibrant local markets like La Rotunda and Mercado San Jose, and exploring the numerous cafe-galerias and cultural venues scattered throughout the historic center.
During the rainier months, visitors can take advantage of indoor attractions such as the famous Anthropology Museum with its extensive collection of Olmec artifacts and various art galleries that display the city's rich cultural heritage. The region receives substantial rainfall annually, particularly during the wet season. Now, let's explore all the climate details to give you a complete picture.
Pick a month to see the average temperature, rainfall and sunshine in Xalapa - and find the best time to visit.
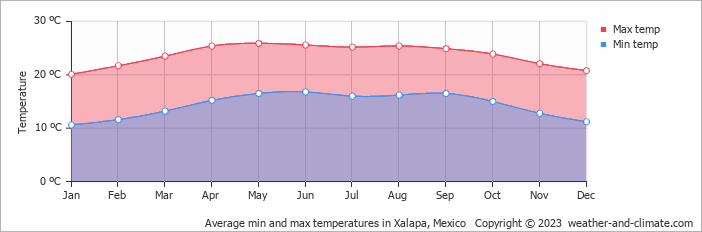
With minimal seasonal shifts, Xalapa experiences a constant climate year-round. Typically, average maximum daytime temperatures range from a comfortable 26°C (79°F) in May to a pleasant 20°C (68°F) in the coolest month, January.
Nights vary from 17°C (63°F) in May to around 11°C (52°F) during the colder months.
Check out our detailed temperature page for more information.
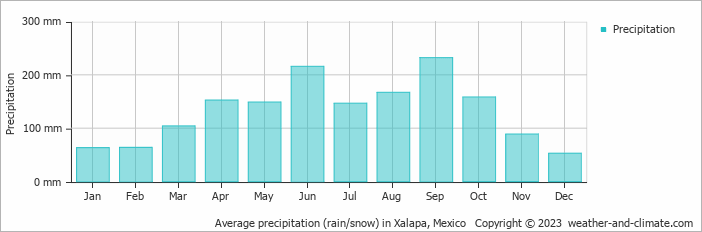
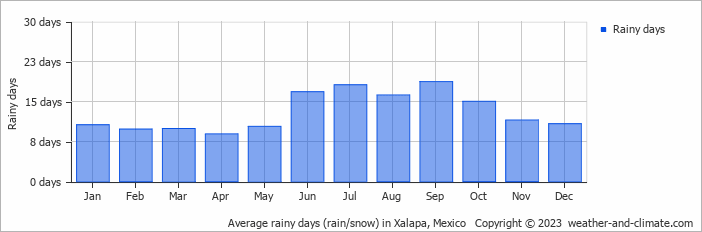
Xalapa has a notably wet climate with abundant precipitation, recording 1592 mm (63 in) of rainfall per year. The climate in Xalapa shows significant variation throughout the year. Expect heavy rainfall in September, the wettest month, with an average of 232 mm (9.1 in) of precipitation over 19 rainy days.
In contrast, the driest month December offers drier and sunnier days, with around 53 mm (2.1 in) of rainfall over 11 rainy days. For more details, please visit our Xalapa Precipitation page.
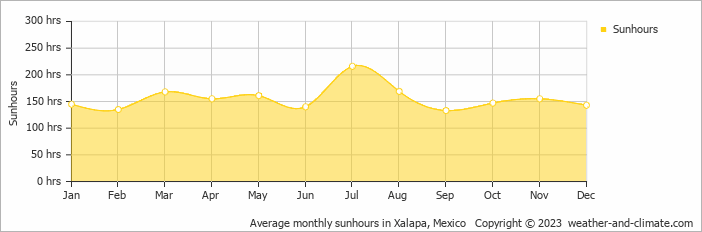
Xalapa offers a pleasant mix of sunny and slightly overcast days. The difference in sunshine hours between July (7.2 hours daily) and September (4.4 hours daily) provides a bit of variety for visitors and residents.
Visit our detailed sunshine hours page for more information.
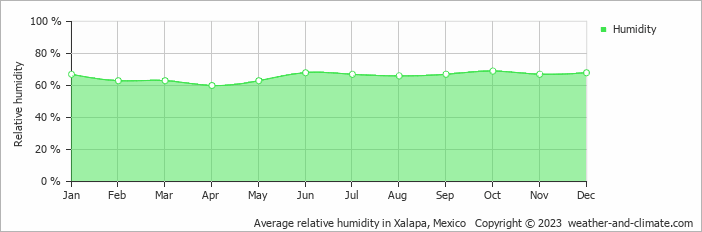
The relative humidity is high throughout the year in Xalapa.
The city experiences its highest humidity in October, reaching 69%. In April, the humidity drops to its lowest level at 60%. What does this mean? Read our detailed page on humidity levels for further details.
Monthly ratings reflect general weather comfort, based on daytime temperature and rainfall. Swimming and winter conditions are highlighted separately where relevant.
January, February, November and December typically offer the most optimal weather in Xalapa. In contrast, June and September tend to have less optimal conditions.
Daytime highs range from 20°C (68°F) in January to 26°C (79°F) in May. Nighttime lows range from 11°C (52°F) to 17°C (63°F). Temperatures stay relatively stable year-round.
Annual rainfall is around 1592 mm (63 in). September is the wettest month with 232 mm (9.1 in), while December is the driest with 53 mm (2.1 in).
Xalapa receives around 1,867 hours of sunshine per year. July is the sunniest month with 216 hours, while September is the cloudiest with just 133 hours.
Xalapa is highlighted - select any city to see its climate.
Where to go in October - average daytime high across popular destinations.
 Los Cabos32°C (90°F) Puerto Peñasco30°C (86°F) Tulum
 30°C (86°F) Puerto Vallarta29°C (84°F) Cancún30°C (86°F) Playa del Carmen30°C (86°F) Mexico City
 22°C (72°F)
 Need travel inspiration? Check out our bucket list articles and be inspired.
Warm Sea Without Extreme Heat: 8 Beach Destinations With Comfortable Weather
Love warm seawater but not extreme heat? Compare eight beach destinations where the sea stays warm while daytime temperatures remain comfortable.

 Best Spring Break Destinations for Great Weather and Fewer Crowds
Skip crowded spring break resorts. Compare March weather and travel style in Puerto Escondido, San Juan del Sur, Roatán, Caye Caulker and Curaçao.

 Warm Days, Cool Nights: 8 Destinations With the Perfect Day-Night Temperature
Prefer warm sunny days but cool evenings? Compare eight destinations with daytime temperatures of around 25–30°C, cooler nights, low rainfall and plenty of sunshine.

 Where to Travel in July and August: Mexico, Thailand, Indonesia or Somewhere Else?
Compare July and August weather in Mexico, Thailand, Indonesia, Zanzibar and Sri Lanka, using historical climate data for temperature, rainfall and sunshine.