Xalapa Sunshine Hours by Month
In climate discussions, the hours of sunlight reveal much about a location. This page shows the total number of hours of direct sunlight per month and the average hours per day in Xalapa, Veracruz, Mexico. This average is based on long-term data collected between 1990 and 2020.
Monthly hours of sunshine
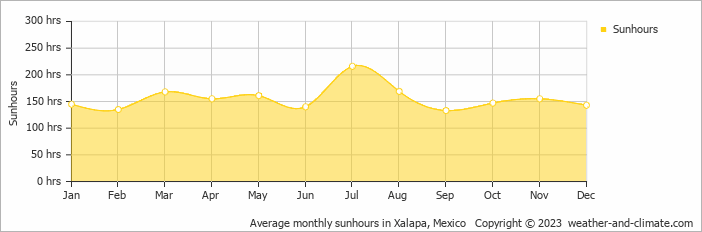
Xalapa Nusa Penida experiences both sunny and cloudy or rainy periods, with some seasonal variation. It receives approximately 216 hours of sunshine in July and 133 hours in September, contributing to a total annual sunshine amount of 1867 hours.
Daily hours of sunshine
The difference in daily sunshine hours between July (7.2 hours per day) and September (4.4 hours per day) offers moderate variety for visitors and residents.
Xalapa vs Major Cities: Sunshine Compared
Xalapa enjoys an average of 1867 hours of sunshine annually. Let’s compare this with some popular tourist destinations:
Athens, Greece, enjoys 2769 hours of sunshine each year, making it one of the sunniest destinations in the Mediterranean region.
In contrast, Tromsø , Norway, receives only about 1270 hours of sunshine per year, known for the polar night with no sunlight for weeks during winter.
Vancouver, Canada, receives approximately 1940 hours of sunshine annually.
In Tokyo, Japan, the average annual sunshine is 1930 hours, with sunny periods between rainy seasons.
Related Climate Data for Xalapa
September, Xalapa’s wettest month, receives 149 mm (5.9 in) of rainfall and has a maximum daytime temperature of 25°C (77°F). During the driest month December you can expect a temperature of 21°C (70°F).
For more detailed insights into the city’s temperatures, check out our Temperature page. To explore more about precipitation patterns, visit our Xalapa Precipitation page.


