















 An alternative way to discover Sydney
We have made an overview of the sights in Sydney that you must see if you want to visit Sydney in an alternative way.
Average temperatures, rainfall, sunshine and the best time to visit Wannanup.
 –
–
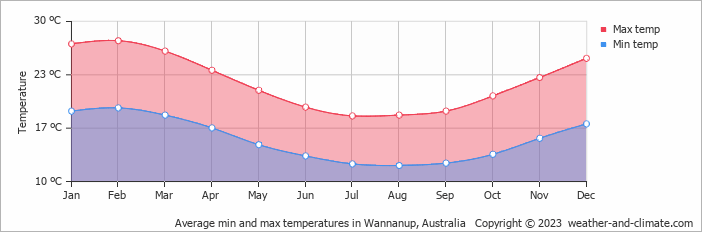
The climate in Wannanup, Western Australia, Australia, sees a moderate range of temperatures across the year, from 28°C (82°F) in February down to 18°C (64°F) in July.
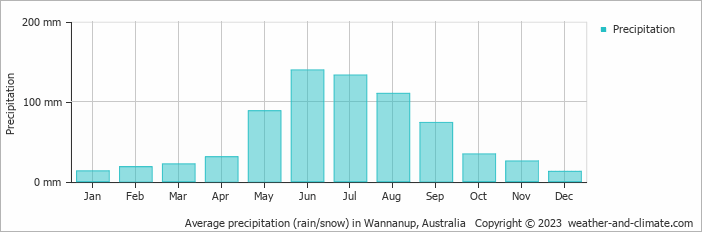
The city receives around 700 mm (28 in) of rainfall per year. It experiences a distinct dry season from October to April. June is the wettest month and December the driest.
Pick a month to see the average temperature, rainfall and sunshine in Wannanup - and find the best time to visit.
The weather in Wannanup changes moderately throughout the year, offering enough variation to appreciate each season. On average, daytime temperatures range from a comfortable 28°C (82°F) in February to a pleasant 18°C (64°F) in July.
Nighttime temperatures range from 19°C (66°F) in February to 12°C (54°F) in July.
Check out our detailed temperature page for more information.
On average, Wannanup receives a reasonable amount of rainfall, with an annual precipitation of 700 mm (28 in). The seasons in Wannanup bring significant changes in precipitation. The wettest month, June, receives high rainfall, with an average of 139 mm (5.5 in) of precipitation. This rainfall is distributed across 14 rainy days.
In contrast, the driest month, December, experiences much less rainfall, totaling 13 mm (0.5 in) over 4 rainy days. These distinct seasonal differences provide diverse experiences throughout the year. For more details, please visit our Wannanup Precipitation page.

Monthly ratings reflect general weather comfort, based on daytime temperature and rainfall. Swimming and winter conditions are highlighted separately where relevant.
January, February, March, April, May, October, November and December typically offer the most optimal weather in Wannanup. In contrast, June, July and August tend to have less optimal conditions. Wannanup has a distinct dry season from October to April.
Daytime highs range from 18°C (64°F) in July to 28°C (82°F) in February. Nighttime lows range from 12°C (54°F) to 19°C (66°F).
Annual rainfall is around 700 mm (28 in). June is the wettest month with 139 mm (5.5 in), while December is the driest with 13 mm (0.5 in).
Wannanup is highlighted - select any city to see its climate.
Where to go in October - average daytime high across popular destinations.
Noosa Heads25°C (77°F) Brisbane 26°C (79°F) Byron Bay24°C (75°F) Gold Coast
 24°C (75°F) Perth23°C (73°F) Sydney22°C (72°F) Adelaide20°C (68°F) Melbourne20°C (68°F)
 Need travel inspiration? Check out our bucket list articles and be inspired.
An alternative way to discover Sydney
We have made an overview of the sights in Sydney that you must see if you want to visit Sydney in an alternative way.
 The most relaxed and alternative area of Australia is called the Byron Shire
The Byron Shire is one of the most pretty areas in the world. Not only in terms on natural beauty, also the relaxed vibe and people make this an area that remains close to your heart.
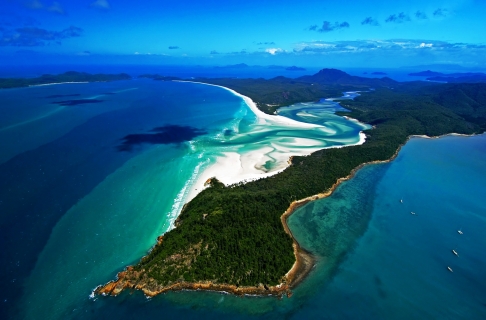 Sail the Whitsunday islands
The best travel period to sail the Whitsunday islands is “winter” between June and October, with pleasant temperatures around 23 degrees Celsius (74 Fahrenheit).
 The best dive spots in Australia
Explore Australia's best dive spots: from the Great Barrier Reef to HMAS Perth. Discover vibrant corals, marine life, and historic wrecks.