















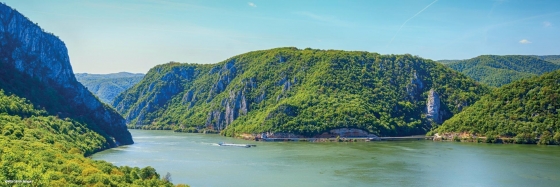
 Cycle the Danube trail
The Danube cycle route is one of the most popular cycling routes in Europe, and rightly so, because it is a varied route that is interesting both in terms of culture and nature.
Average temperatures, rainfall, sunshine and the best time to visit Vinci.
 –
–
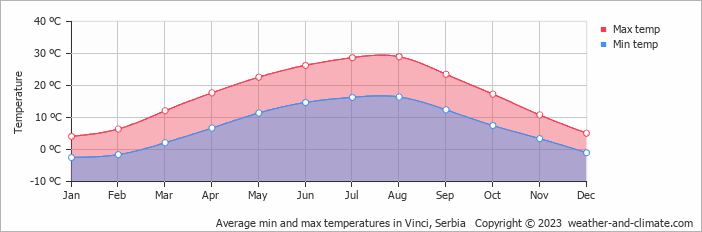
Temperatures in Vinci, Central Serbia, Serbia, vary greatly throughout the year. August is the hottest month at 29°C (84°F), while January is the coldest at 4°C (39°F).
The city receives around 771 mm (30 in) of rain/snowfall per year. It experiences warm summers and cold winters. June is the wettest month and August the driest.
Pick a month to see the average temperature, rainfall and sunshine in Vinci - and find the best time to visit.
The climate in Vinci is known for significant temperature differences throughout the year, making the weather dynamic. On average, daytime temperatures range from a comfortable 29°C (84°F) in August to a chilly 4°C (39°F) in January.
Nighttime temperatures range from 16°C (61°F) in August to -3°C (27°F) in January.
Check out our detailed temperature page for more information.
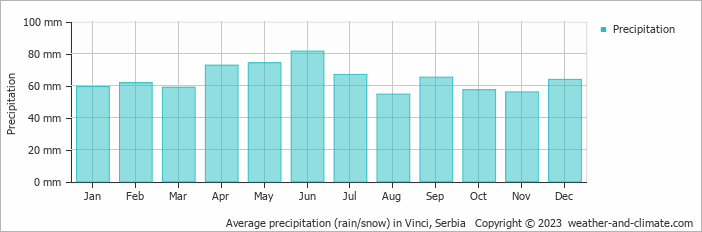
Generally, Vinci receives mid-range precipitation levels, with 771 mm (30 in) annually. The wettest period in Vinci occurs in June, which receives around 81 mm (3.2 in) of precipitation. During the driest month, August, Vinci experiences moderate rainfall, totaling 55 mm (2.2 in). The consistent precipitation levels throughout the year contribute to a relatively stable climate. For more details, please visit our Vinci Precipitation page.
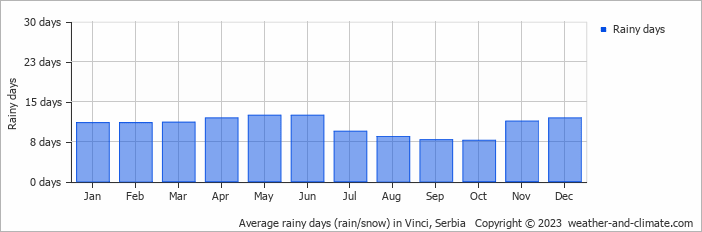
Monthly ratings reflect general weather comfort, based on daytime temperature and rainfall. Swimming and winter conditions are highlighted separately where relevant.
May, June, July, August and September typically offer the most optimal weather in Vinci. In contrast, January, February and December tend to have less optimal conditions. Vinci has warm summers and cold winters.
Daytime highs range from 4°C (39°F) in January to 29°C (84°F) in August. Nighttime lows range from -3°C (27°F) to 16°C (61°F). Temperatures vary considerably through the year.
Annual rainfall is around 771 mm (30 in). June is the wettest month with 81 mm (3.2 in), while August is the driest with 55 mm (2.2 in).
Vinci is highlighted - select any city to see its climate.
Where to go in October - average daytime high across popular destinations.
 Belgrade
 19°C (66°F) Novi Sad19°C (66°F) Niš19°C (66°F) Palić18°C (64°F) Kragujevac19°C (66°F) Vrnjačka Banja18°C (64°F) Kopaonik17°C (63°F) Zlatibor17°C (63°F)
 Need travel inspiration? Check out our bucket list articles and be inspired.
Cycle the Danube trail
The Danube cycle route is one of the most popular cycling routes in Europe, and rightly so, because it is a varied route that is interesting both in terms of culture and nature.

 The 10 most charming villages in France
Discover France's top 10 beautiful villages. From Normandy to the Côte d'Azur, experience quaint squares and cobbled streets. Which one will you visit this summer?

 The train journey from Bucharest to Brasov is one of the most beautiful in Romania
In three hours, you'll get from Bucharest to Brasov by train. It is one of the most beautiful routes in Romania, certainly the most beautiful that can be done by express train.
 An alternative way to discover Paris
From street art, vintage shops, vegetarian cafes, to amazing cultural events, Paris has much to offer for the creative traveler. An overview of sights that you must see if you want to visit this city in an alternative way.