Vijlen Weather & Climate: Best Time to Visit
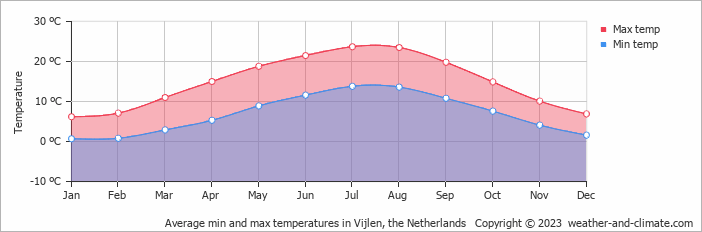
The climate in Vijlen, Limburg, Netherlands, is marked by large temperature swings across the seasons, ranging from 24°C (75°F) in July to 6°C (43°F) in January.
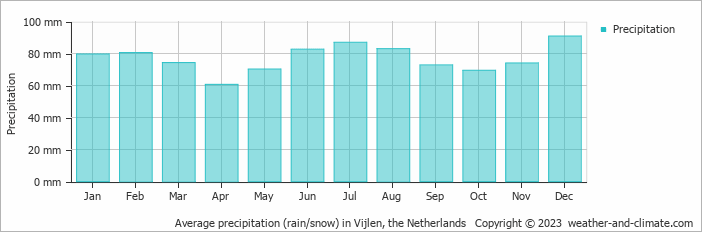
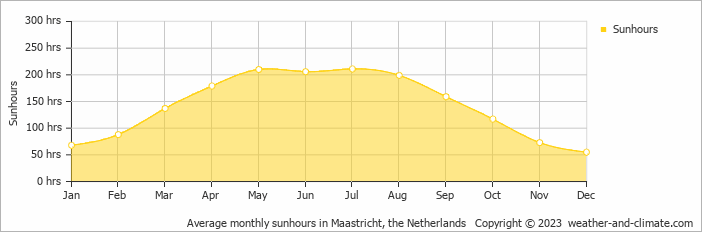
Annual rain/snowfall is moderate at around 924 mm (36 in), with December being the wettest month. The sunniest month is July, with 7.0 hours of sunshine per day on average.
Monthly Temperature in Vijlen
In Vijlen, temperatures differ significantly between summer and winter months. Average daytime temperatures reach a comfortable 24°C (75°F) in July. In January, the coolest month of the year, temperatures drop to a chilly 6°C (43°F).
At night, temperatures range from around 14°C (57°F) in July to 1°C (34°F) in January.
Check out our detailed temperature page for more information.
Temperature ranges by month
Rainfall in Vijlen
On average, Vijlen receives a reasonable amount of rain/snowfall, with an annual precipitation of 924 mm (36 in). Despite minor fluctuations, Vijlen enjoys fairly consistent precipitation throughout the year. In December, you can expect around 91 mm (3.6 in) of precipitation, while in April, Vijlen receives about 61 mm (2.4 in). For more details, please visit our Vijlen Precipitation page.
The mean monthly precipitation over the year, including rain, hail, and snow
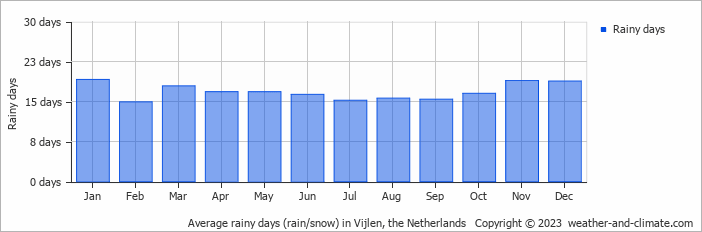
The average number of days each month with precipitation
Sunshine Hours in Vijlen
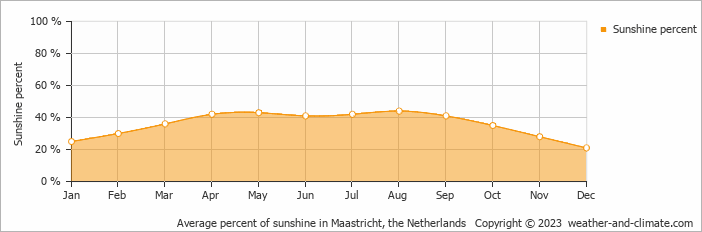
Vijlen can be enjoyed more throughout the sunniest month of July under a blue sky, with approximately 7.0 hours of sunshine daily. In contrast, the city experiences much darker days in December, with only 1.8 hours of sunlight per day.
Visit our detailed sunshine hours page for more information.
Monthly hours of sunshine
Daily hours of sunshine
Daily percentage of sunshine
Humidity in Vijlen by Month
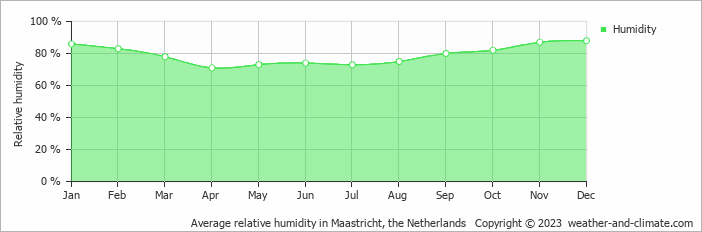
The relative humidity is high throughout the year in Vijlen.
The city experiences its highest humidity in December, reaching 88%. In April, the humidity drops to its lowest level at 71%. What does this mean? Read our detailed page on humidity levels for further details.
Relative humidity over the year
Wind Speed in Vijlen
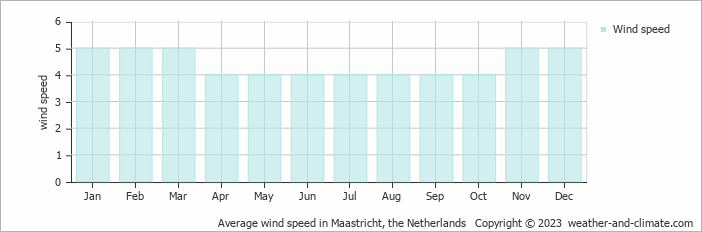
The mean wind speed varies between 4 m/s (8 knots) and 5 m/s (10 knots) throughout the year. It is lowest in April, May, June, July, August, September and October and highest during January, February, March, November and December. What does this mean?
The mean monthly wind speed over the year (meters per second)
Vijlen 3-Day Forecast
Check the conditions for any month of the year.


