Verdabbio Weather & Climate: Best Time to Visit
The climate in Verdabbio, Grisons, Switzerland, is marked by large temperature swings across the seasons, ranging from 22°C (72°F) in July to 2°C (36°F) in January.
With around 1455 mm (57 in) of annual rain/snowfall, Verdabbio has a notably wet climate. The wettest month is November. Sunshine peaks in July, when the city sees around 8.9 hours of sunshine per day.
Monthly Temperature in Verdabbio
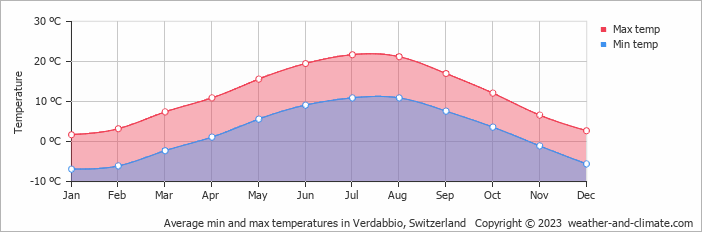
In Verdabbio, temperatures differ significantly between summer and winter months. Average daytime temperatures reach a pleasant 22°C (72°F) in July. In January, the coolest month of the year, temperatures drop to a very cold 2°C (36°F).
At night, temperatures range from around 11°C (52°F) in July to -7°C (19°F) in January.
Check out our detailed temperature page for more information.
Temperature ranges by month
Rainfall in Verdabbio
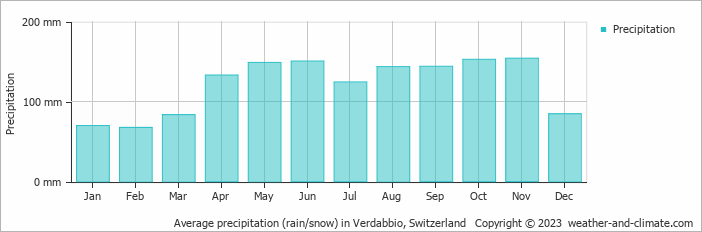
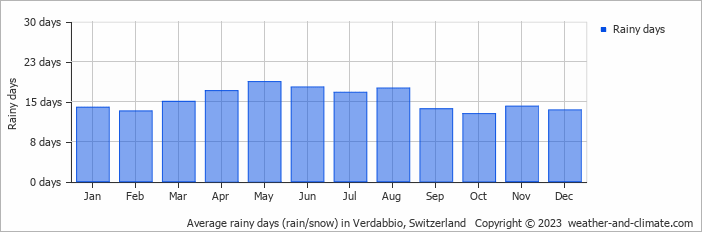
Verdabbio experiences significant rain/snowfall throughout the year, averaging 1455 mm (57 in) of precipitation annually. Verdabbio can be quite wet during November, receiving approximately 154 mm (6.1 in) of precipitation over 14 snowy/rainy days.
In contrast, during the driest month (February), you will experience much drier conditions, with 67 mm (2.6 in) of precipitation spread across 13 snowy/rainy days days. For more details, please visit our Verdabbio Precipitation page.
The mean monthly precipitation over the year, including rain, hail, and snow
The average number of days each month with precipitation
Sunshine Hours in Verdabbio
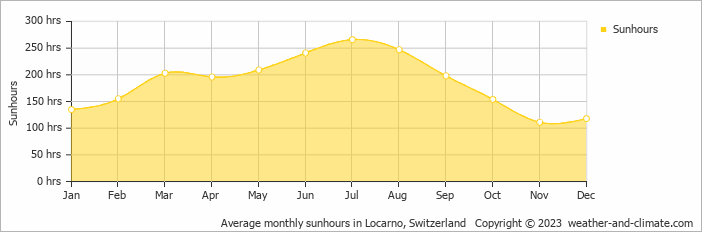
Verdabbio can be enjoyed more throughout the sunniest month of July under a blue sky, with approximately 8.9 hours of sunshine daily. In contrast, the city experiences much darker days in November, with only 3.7 hours of sunlight per day.
Visit our detailed sunshine hours page for more information.
Monthly hours of sunshine
Daily hours of sunshine
Daily percentage of sunshine
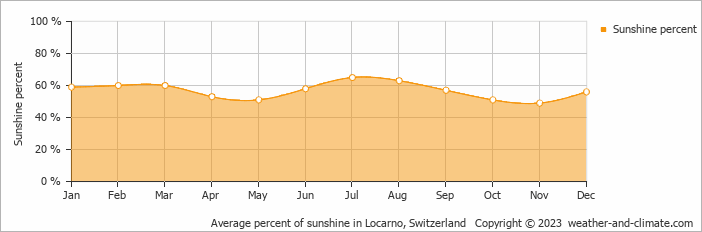
Humidity in Verdabbio by Month
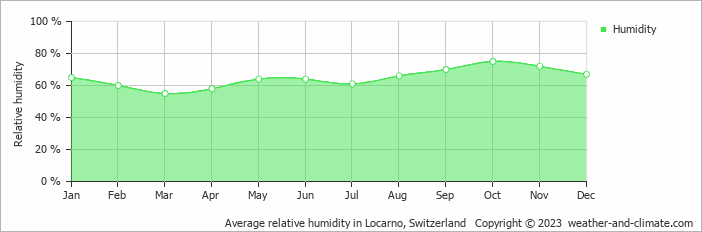
The relative humidity is high throughout the year in Verdabbio.
The city experiences its highest humidity in October, reaching 75%. In March, the humidity drops to its lowest level at 55%. What does this mean? Read our detailed page on humidity levels for further details.
Relative humidity over the year
Verdabbio 3-Day Forecast
Check the conditions for any month of the year.