Ventry Weather & Climate: Best Time to Visit
Temperatures in Ventry, Kerry, Ireland, shift moderately through the seasons. The warmest month is August at 18°C (64°F), and the coolest is February at 11°C (52°F).
The city receives considerable rainfall, with around 1511 mm (59 in) annually. November is the wettest month. May is the sunniest month, averaging 6.0 hours of sunshine per day.
Monthly Temperature in Ventry
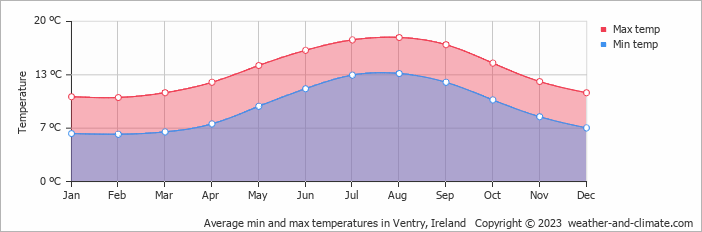
In Ventry, seasonal changes bring about a moderate variation in temperatures. Typically, average maximum daytime temperatures range from a pleasant 18°C (64°F) in August to a chilly 11°C (52°F) in the coolest month, February.
Nights vary from 14°C (57°F) in August to around 6°C (43°F) during the colder months.
Check out our detailed temperature page for more information.
Temperature ranges by month
Rainfall in Ventry
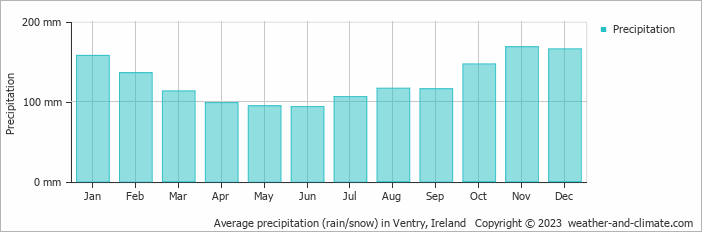
Ventry has a notably wet climate with abundant precipitation, recording 1511 mm (59 in) of rainfall per year. Ventry offers a pleasant mix of wetter and slightly drier months. The difference in precipitation between the wettest month November (168 mm (6.6 in)) and the driest month June (93 mm (3.7 in)) is not too significant. For more details, please visit our Ventry Precipitation page.
The mean monthly precipitation over the year, including rain, hail, and snow
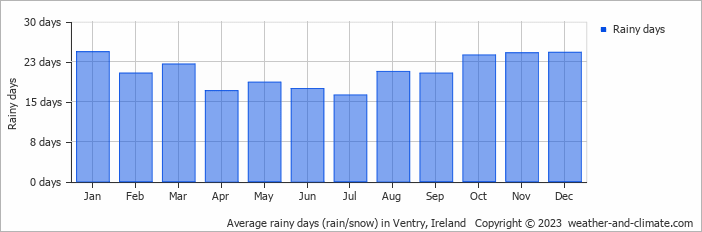
The average number of days each month with precipitation
Sunshine Hours in Ventry
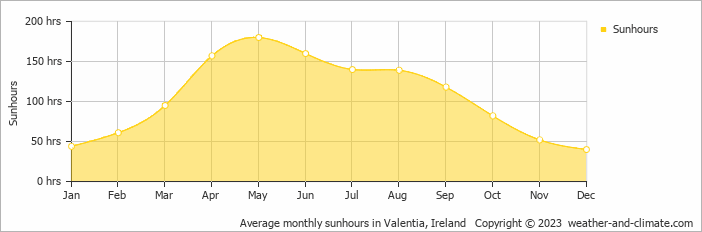
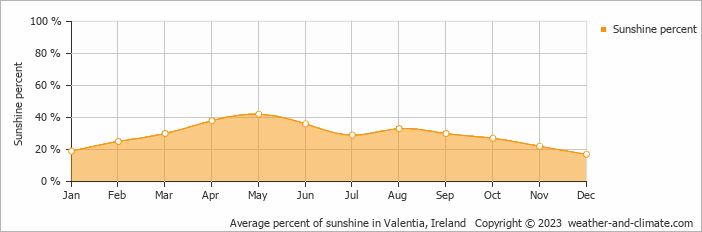
For those who appreciate different seasons, Ventry serves as an ideal destination. Expect longer, more sun-filled days in May with an average of 6.0 hours of sunshine daily, and embrace the darker days in December, offering only 1.3 hours of daily sunlight.
Visit our detailed sunshine hours page for more information.
Monthly hours of sunshine
Daily hours of sunshine
Daily percentage of sunshine
Water Temperature in Ventry
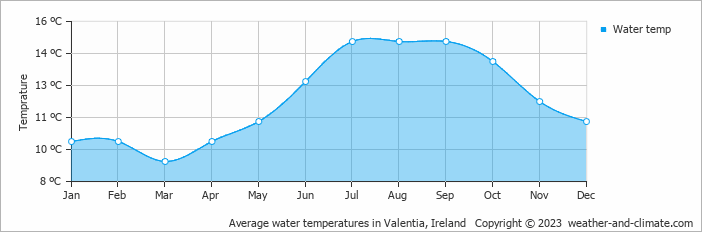
The mean water temperature over the year ranges from 9°C (48°F) in March to 15°C (59°F) in July.
Water temperature over the year
Humidity in Ventry by Month
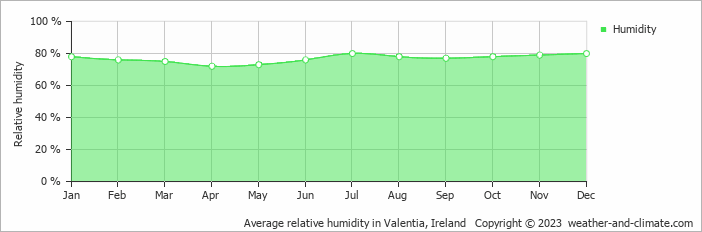
The relative humidity is high throughout the year in Ventry.
The city experiences its highest humidity in July, reaching 80%. In April, the humidity drops to its lowest level at 72%. What does this mean? Read our detailed page on humidity levels for further details.
Relative humidity over the year
Wind Speed in Ventry
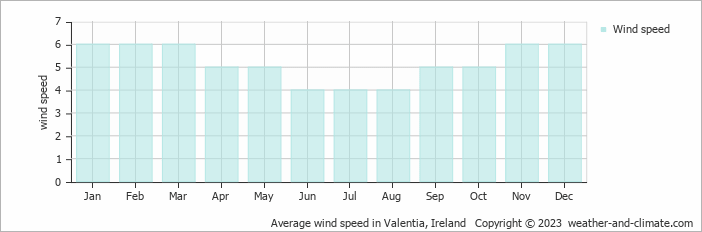
The average wind speed over the year ranges from 4 m/s (8 knots) to 6 m/s (12 knots). It is lower in June, July and August and higher in January, February, March, November and December. What does this mean?
The mean monthly wind speed over the year (meters per second)
Ventry 3-Day Forecast
Check the conditions for any month of the year.
Best Time to Visit Ventry
Ventry's weather is most enjoyable during June, July, August and September, with comfortable temperatures from 16°C (62°F) to 18°C (64°F). The moderate conditions ensure pleasant weather for exploring the area. Expect varied weather during this period with rainfall between 93 mm (3.7 in) and 116 mm (4.6 in), providing a good balance of sunny and rainy days.The wettest months are November and December, when precipitation is at its highest. Planning your next adventure but unsure where to go? Our climate tool suggests perfect locations tailored to your preferred weather conditions. Discover your ideal travel destination with our weather planner.