Untervaz Climate by Month
Untervaz experiences great temperature shifts.
The city's weather can transition from pleasant days
to very cold weather.
It is also known for its large amounts of rain/snowfall.
Now, let’s explore all the climate details to give you a full picture.
Average day and night temperature
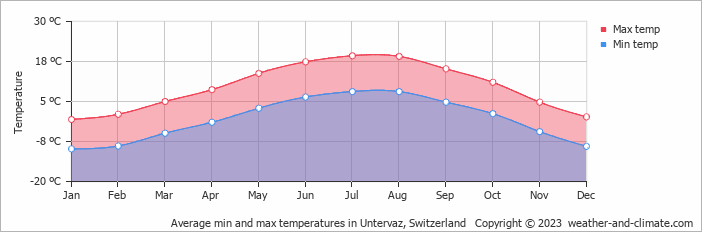
The climate in Untervaz is known for significant temperature differences throughout the year, making the weather dynamic. Typically, daytime temperatures range from a pleasant 19°C in July to a very cold -1°C in the coolest month, January. Nights are cooler, with temperatures generally dropping to -10°C, particularly during the colder months.
The mean minimum and maximum temperatures throughout the year
Precipitation and rainy days
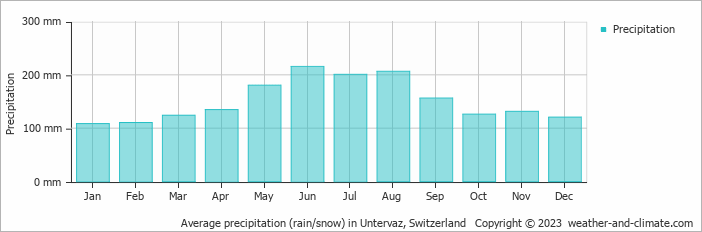
Untervaz has a notably wet climate with abundant precipitation, recording 1813 mm of rain/snowfall per year. Untervaz offers a pleasant mix of wetter and slightly drier months. The difference in precipitation between June (215 mm) and January (108 mm) is not too significant, making the climate enjoyable for visitors and residents alike.The mean monthly precipitation over the year, including rain, hail and snow
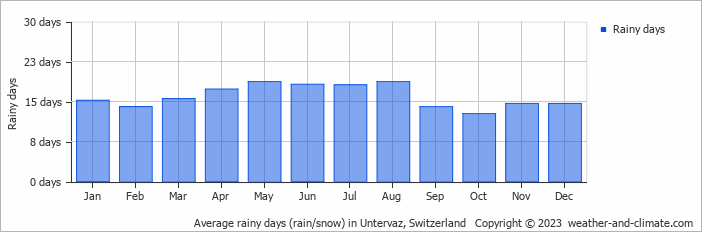
The average number of days each month with precipitation
Sunshine over the year
For those who appreciate different seasons, Untervaz serves as an ideal destination. Expect longer, more sun-filled days in July with an average of 6.4 hours of sunshine daily, and embrace the darker days in December, offering only 1.7 hours of daily sunlight.Monthly hours of sunshine
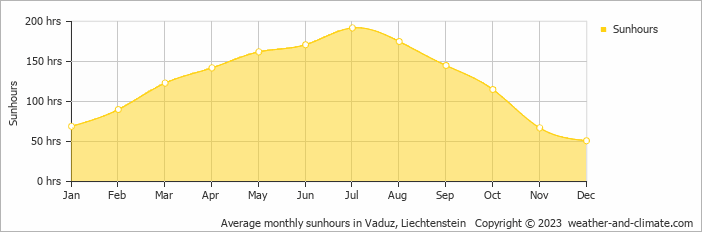
Daily hours of sunshine
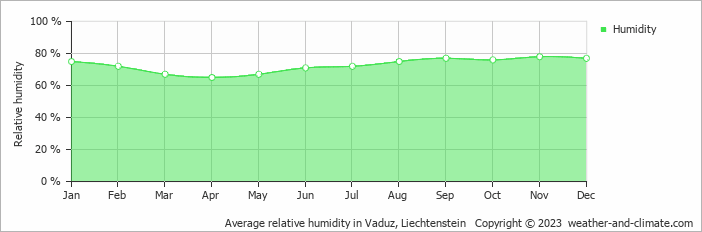
Average humidity
The relative humidity is moderate throughout the year in Untervaz.
Relative humidity over the year
The best time of year to visit Untervaz in Switzerland
Other facts from our historical weather data:Rainy season in Untervaz occurs in the months of May, June, July, August and September.
The coldest season / winter is in the following months: January, February and December.
July has an average maximum temperature of 19°C and is the warmest month of the year.
The coldest month is January with an average maximum temperature of -1°C.
June tops the wettest month list with 215 mm of rainfall.
January is the driest month with 108 mm of precipitation.
July is the sunniest month with an average of 192 hours of sunshine.
No idea where to travel to this year? We have a tool that recommends destinations based on your ideal conditions. Find out where to go with our weather planner.