












Uğurlu Weather & Climate: Best Time to Visit

Average temperatures, rainfall, sunshine and the best time to visit Uğurlu.

Climate overview of Uğurlu

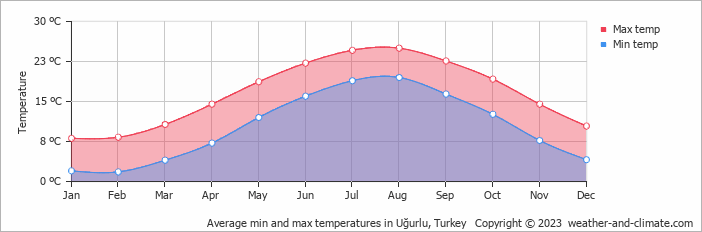
The climate in Uğurlu, Turkey, is marked by large temperature swings across the seasons, ranging from 25°C (77°F) in August to 8°C (46°F) in January.

The city has a wet climate, receiving around 1752 mm (69 in) of rain/snowfall per year. Despite the high annual total, it has warm summers and cold winters. September is the wettest month. Sunshine peaks in June, when the city sees around 7.0 hours of sunshine per day.

Uğurlu Weather by Month

Pick a month to see the average temperature, rainfall and sunshine in Uğurlu - and find the best time to visit.

Monthly Temperature in Uğurlu

In Uğurlu, temperatures differ significantly between summer and winter months. On average, daytime temperatures range from a comfortable 25°C (77°F) in August to a chilly 8°C (46°F) in January.

Nighttime temperatures range from 20°C (68°F) in August to 2°C (36°F) in January.

Check out our detailed temperature page for more information.

Temperature ranges by month

Rainfall in Uğurlu

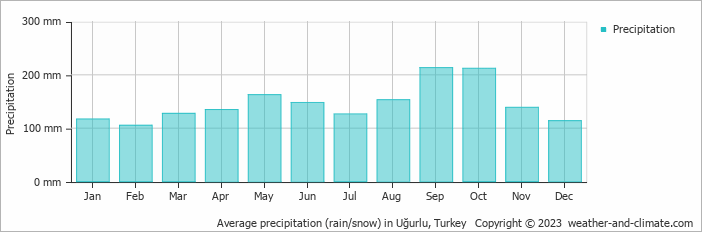
Uğurlu experiences significant rain/snowfall throughout the year, averaging 1752 mm (69 in) of precipitation annually. The amount of precipitation varies moderately throughout the year. The wettest month, September, sees around 213 mm (8.4 in) of rainfall, perfect for those who enjoy a bit of rain now and then. The driest month, February, still receives a respectable 105 mm (4.1 in) of rainfall. For more details, please visit our Uğurlu Precipitation page.

The mean monthly precipitation over the year, including rain, hail, and snow

Sunshine Hours in Uğurlu

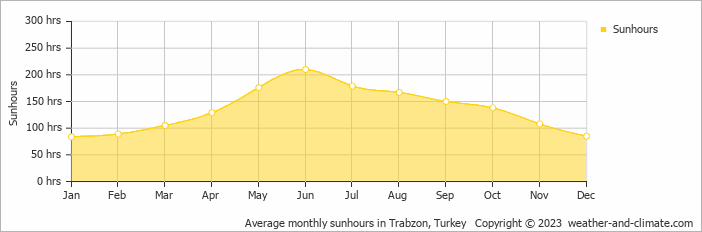
In Uğurlu, summer days are longer and more sunny, with daily sunshine hours peaking at 7.0 hours in June. As the darker season arrives, the brightness of the sun becomes less. January sees a soft sun for only 2.8 hours per average day.

Visit our detailed sunshine hours page for more information.

Monthly hours of sunshine

Data from: Trabzon, Turkey (5 KM, 3 Miles).

Daily hours of sunshine

Data from: Trabzon, Turkey (5 KM, 3 Miles).

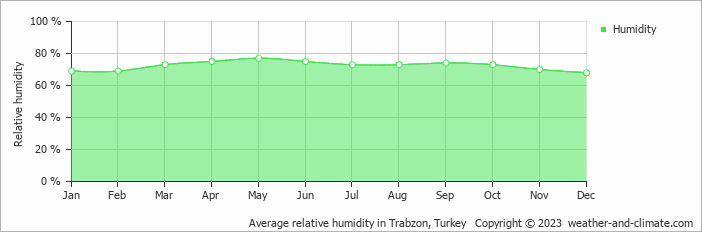
Humidity in Uğurlu by Month

Best Time to Visit Uğurlu

Conditions in Uğurlu are generally most comfortable in June, July and August. They are typically least comfortable in January, February, March, October and December.

Monthly ratings reflect general weather comfort, based on daytime temperature and rainfall. Swimming and winter conditions are highlighted separately where relevant.

  • Best overall: June, July and August
  • Warmest weather: July and August
  • Most sunshine: June
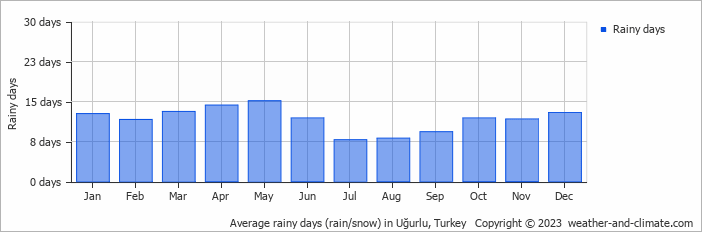
  • Fewest rainy days: July, August and September
  • Seasonal pattern: Warm summers and cold winters

Frequently asked questions about the climate in Uğurlu

What is the best time to visit Uğurlu?

June, July and August typically offer the most optimal weather in Uğurlu. In contrast, January, February, March, October and December tend to have less optimal conditions. Uğurlu has warm summers and cold winters.

What temperatures can I expect in Uğurlu?

Daytime highs range from 8°C (46°F) in January to 25°C (77°F) in August. Nighttime lows range from 2°C (36°F) to 20°C (68°F). Temperatures vary considerably through the year.

How much rain does Uğurlu get?

Annual rainfall is around 1752 mm (69 in). September is the wettest month with 213 mm (8.4 in), while February is the driest with 105 mm (4.1 in).

How sunny is Uğurlu?

Uğurlu receives around 1,620 hours of sunshine per year. June is the sunniest month with 210 hours, while January is the cloudiest with just 84 hours.

Uğurlu 3-Day Forecast

Uğurlu on the map

Uğurlu is highlighted - select any city to see its climate.

Popular this month

Where to go in September - average daytime high across popular destinations.

Bucket list

Need travel inspiration? Check out our bucket list articles and be inspired.