

















 The 10 most alternative cities in South America
Discover South America's top 10 alternative cities! From Valparaíso's vibrant streets to La Paz's high-altitude charm and Medellín's innovative spirit.
Average temperatures, rainfall, sunshine and the best time to visit Tianguá.
 –
–
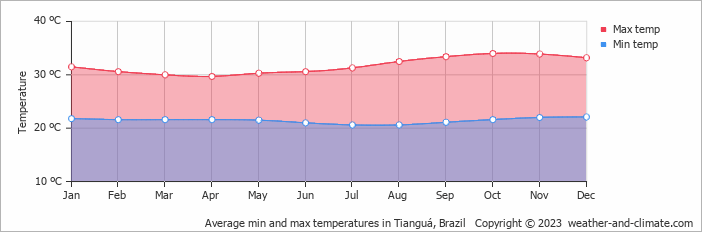
Tianguá, Ceará, Brazil, has a stable climate with little temperature variation across the year. Average daytime temperatures hover around 32°C (90°F), peaking in October at 34°C (93°F) and dipping in April to 30°C (86°F).
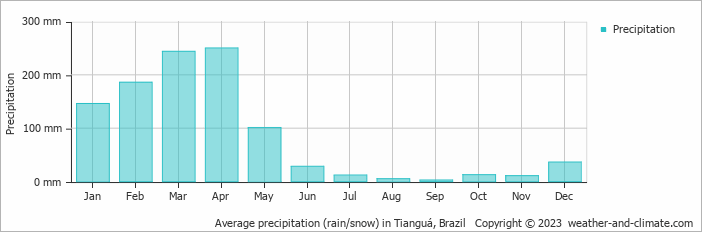
The city receives considerable rainfall, with around 1034 mm (41 in) annually. April is the wettest month. It has distinct dry (June to December) and wet (February to April) seasons.
Pick a month to see the average temperature, rainfall and sunshine in Tianguá - and find the best time to visit.
With minimal seasonal shifts, Tianguá experiences a constant climate year-round. Typically, average maximum daytime temperatures range from a very warm 34°C (93°F) in October to a comfortable 30°C (86°F) in the coolest month, April.
Nights vary from 22°C (72°F) in October to around 21°C (70°F) during the colder months.
Check out our detailed temperature page for more information.
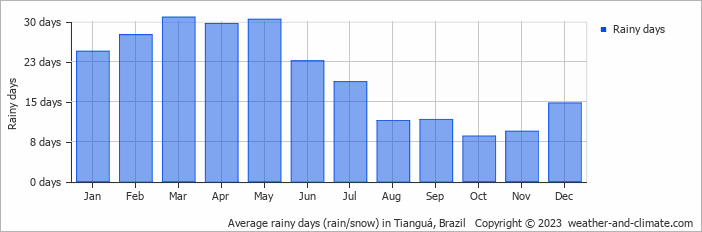
Tianguá has a notably wet climate with abundant precipitation, recording 1034 mm (41 in) of rainfall per year. The climate in Tianguá shows significant variation throughout the year. Expect heavy rainfall in April, the wettest month, with an average of 250 mm (9.8 in) of precipitation over 30 rainy days.
In contrast, the driest month September offers drier and sunnier days, with around 2.6 mm (0.1 in) of rainfall over 12 rainy days. For more details, please visit our Tianguá Precipitation page.
Monthly ratings reflect general weather comfort, based on daytime temperature and rainfall. Swimming and winter conditions are highlighted separately where relevant.
June and July typically offer the most optimal weather in Tianguá. In contrast, February, March, April, October and November tend to have less optimal conditions. Tianguá has distinct dry (June to December) and wet (February to April) seasons.
Daytime highs range from 30°C (86°F) in April to 34°C (93°F) in October. Nighttime lows range from 21°C (70°F) to 22°C (72°F). Temperatures stay relatively stable year-round.
Annual rainfall is around 1034 mm (41 in). April is the wettest month with 250 mm (9.8 in), while September is the driest with 2.6 mm (0.1 in).
Tianguá is highlighted - select any city to see its climate.
Where to go in September - average daytime high across popular destinations.
Need travel inspiration? Check out our bucket list articles and be inspired.
The 10 most alternative cities in South America
Discover South America's top 10 alternative cities! From Valparaíso's vibrant streets to La Paz's high-altitude charm and Medellín's innovative spirit.

 The 5 most tranquil retreats in the Amazon Rainforest, Brazil
Discover top sustainable lodges in the Amazon. Enjoy unique wildlife, eco-friendly stays, and immersive experiences at Anavilhanas, Cristalino, and more.
 Brazil in November: Where Is the Best Weather?
Discover where Brazil has the best weather in November, comparing Fortaleza, Salvador, Rio, São Paulo, Florianópolis, Brasília and Foz do Iguaçu.
 An alternative way to discover Rio de Janeiro
Don't feel like seeing the traditional tourist sights in Rio de Janeiro? We have made an overview of the sights in Rio de Janeiro that you must see if you want to visit Rio in an alternative way.