















 The 5 most beautiful lakes in Canada
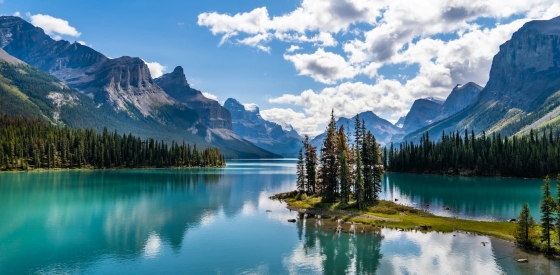
Explore Canada's stunning lakes: Lake Louise, Lake Superior, Maligne Lake, Emerald Lake, and Lake Okanagan, each offering unique beauty and activities.
Average temperatures, rainfall, sunshine and the best time to visit Thunder Bay.
 –
–
Thunder Bay, Ontario, Canada, experiences significant temperature variation throughout the year. Summers bring daytime highs of 23°C (73°F) in August, while winters cool to -8°C (18°F) in January.
The city receives around 744 mm (29 in) of rain/snowfall per year. It experiences a distinct dry season from January to March, with warm summers and very cold winters. September is the wettest month and February the driest.
Pick a month to see the average temperature, rainfall and sunshine in Thunder Bay - and find the best time to visit.
Depending on the time of the year, temperatures range from comfortable to very cold in Thunder Bay. On average, daytime temperatures range from a comfortable 23°C (73°F) in August to a very cold -8°C (18°F) in January.
Nighttime temperatures range from 14°C (57°F) in August to -17°C (1°F) in January.
Check out our detailed temperature page for more information.

Generally, Thunder Bay has a moderate amount of precipitation, averaging 744 mm (29 in) of rain/snowfall annually. The seasons in Thunder Bay bring significant changes in precipitation. The wettest month, September, receives moderate rainfall, with an average of 93 mm (3.7 in) of precipitation. This rainfall is distributed across 13 rainy days.
In contrast, the driest month, February, experiences much less snowfall, totaling 30 mm (1.2 in) over 9 snowy days. These distinct seasonal differences provide diverse experiences throughout the year. For more details, please visit our Thunder Bay Precipitation page.

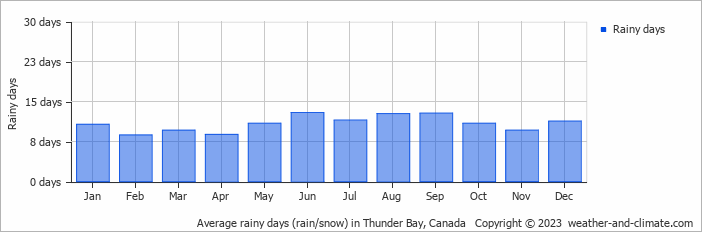
Monthly ratings reflect general weather comfort, based on daytime temperature and rainfall. Swimming and winter conditions are highlighted separately where relevant.
July and August typically offer the most optimal weather in Thunder Bay. In contrast, January, February, March, April, November and December tend to have less optimal conditions. Thunder Bay has a distinct dry season from January to March, with warm summers and very cold winters.
Daytime highs range from -8°C (18°F) in January to 23°C (73°F) in August. Nighttime lows range from -17°C (1°F) to 14°C (57°F). Temperatures vary considerably through the year.
Annual rainfall is around 744 mm (29 in). September is the wettest month with 93 mm (3.7 in), while February is the driest with 30 mm (1.2 in).
Thunder Bay is highlighted - select any city to see its climate.
Where to go in September - average daytime high across popular destinations.
Toronto 22°C (72°F) Niagara Falls23°C (73°F) Montréal
 22°C (72°F) Ottawa22°C (72°F) Quebec City
 20°C (68°F) Vancouver19°C (66°F) Calgary19°C (66°F) Whistler15°C (59°F)
 Need travel inspiration? Check out our bucket list articles and be inspired.
The 5 most beautiful lakes in Canada
Explore Canada's stunning lakes: Lake Louise, Lake Superior, Maligne Lake, Emerald Lake, and Lake Okanagan, each offering unique beauty and activities.
 Canada in September: Where Is the Best Weather?
Compare September weather in Toronto, Montreal, Vancouver, Quebec City and Osoyoos to find Canada's warmest, driest and sunniest destinations.
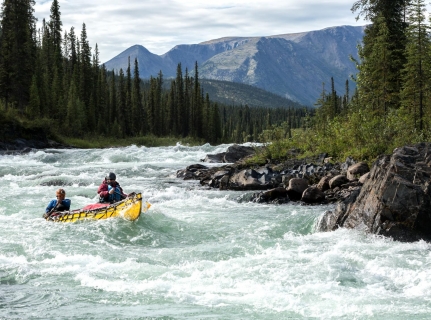 Canoeing the south Nahannii
The South Nahanni in the northwest of Canada is one of the most impressive wilderness rivers in the world. Canoeing the south Nahanni is something you must add to your bucket list.
 See Polar Bears in Churchill Canada
Thousands of bears gather at the small town of Churchill. In the evening the northern lights give a light show against the dark evening sky. An unforgettable experience.