

















 Hike the South West Coast Path
The South West Coast Path means breathtaking nature, kind people and delicious food everywhere you go. It is an unforgettable experience and you need to add it to your bucket list.
Average temperatures, rainfall, sunshine and the best time to visit Thornham.
 –
–
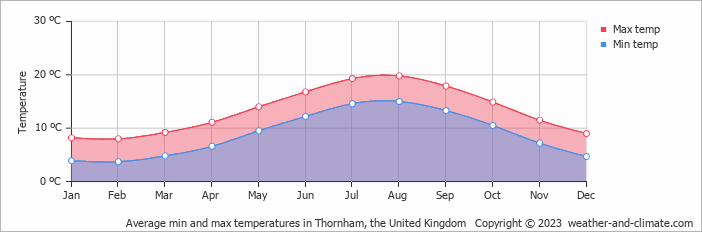
Thornham, Norfolk, United Kingdom, sees big temperature differences between seasons, with August peaking at 20°C (68°F) and February dropping to 8°C (46°F).
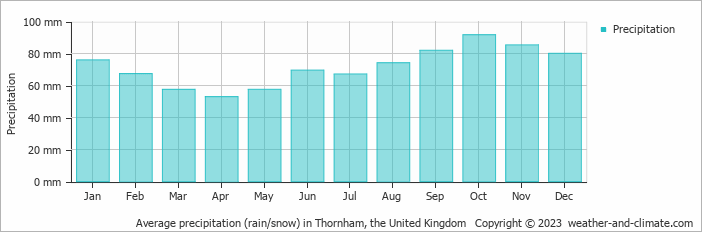
Annual rainfall is moderate at around 861 mm (34 in), with October being the wettest month. The city also has pleasant summers and cold winters. Sunshine peaks in July, when the city sees around 7.1 hours of sunshine per day.
Pick a month to see the average temperature, rainfall and sunshine in Thornham - and find the best time to visit.
Visitors to Thornham can expect significant temperature changes throughout the year. Average daytime temperatures reach a pleasant 20°C (68°F) in August. In February, the coolest month of the year, temperatures drop to a chilly 8°C (46°F).
At night, temperatures range from around 15°C (59°F) in August to 4°C (39°F) in February.
Check out our detailed temperature page for more information.
Generally, Thornham experiences moderate precipitation patterns, averaging 861 mm (34 in) yearly. Thornham experiences moderate seasonal variation in rainfall, with monthly averages ranging from 92 mm (3.6 in) in October, the wettest month, and 53 mm (2.1 in) in April, the driest month. For more details, please visit our Thornham Precipitation page.

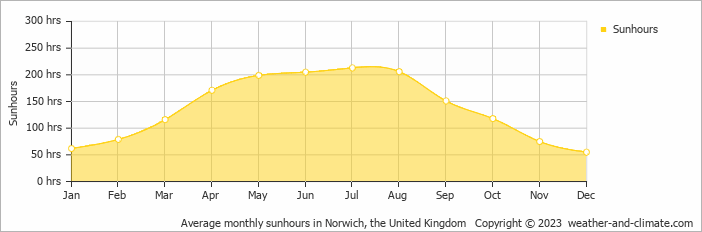
Thornham can be enjoyed more throughout the sunniest month of July under a blue sky, with approximately 7.1 hours of sunshine daily. In contrast, the city experiences much darker days in December, with only 1.8 hours of sunlight per day.
Visit our detailed sunshine hours page for more information.
Monthly ratings reflect general weather comfort, based on daytime temperature and rainfall. Swimming and winter conditions are highlighted separately where relevant.
August typically offers the most optimal weather in Thornham. In contrast, January, February, March and December tend to have less optimal conditions. Thornham has pleasant summers and cold winters.
Daytime highs range from 8°C (46°F) in February to 20°C (68°F) in August. Nighttime lows range from 4°C (39°F) to 15°C (59°F). Temperatures vary considerably through the year.
Annual rainfall is around 861 mm (34 in). October is the wettest month with 92 mm (3.6 in), while April is the driest with 53 mm (2.1 in).
Thornham receives around 1,650 hours of sunshine per year. July is the sunniest month with 213 hours, while December is the cloudiest with just 55 hours.
Thornham is highlighted - select any city to see its climate.
Where to go in October - average daytime high across popular destinations.
London 16°C (61°F) Bath15°C (59°F) Torquay16°C (61°F) Manchester14°C (57°F) York15°C (59°F) Blackpool
 15°C (59°F) Edinburgh13°C (55°F) Glasgow14°C (57°F)
 Need travel inspiration? Check out our bucket list articles and be inspired.
Hike the South West Coast Path
The South West Coast Path means breathtaking nature, kind people and delicious food everywhere you go. It is an unforgettable experience and you need to add it to your bucket list.
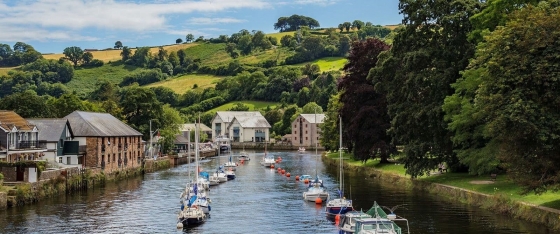 Welcome to Totnes, the hidden treasure of South Devon
Totnes is a place where historical richness fuses effortlessly with a vibrant alternative culture and breathtaking natural surroundings. The town pulses with an amazing community spirit that you'll feel around every corner.
 London's coolest neighborhoods you'll want to visit
Discover the 6 coolest neighborhoods in London for your trip! Explore vibrant Shoreditch, lively Soho, alternative Camden, and many more.
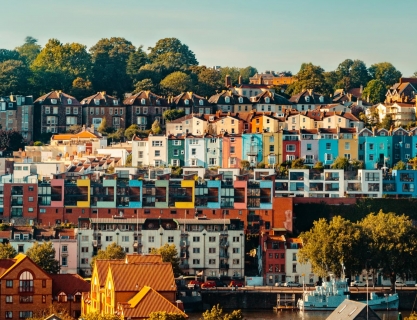 10 cities you should definitely visit in the UK
Discover the top 10 most fun and alternative cities in the UK, rich in art, culture, and adventure. Explore vibrant neighborhoods and unique places.