Tarituba Weather & Climate: Best Time to Visit
With consistently stable weather, Tarituba, Brazil, sees little seasonal temperature change. Daytime highs average 26°C (79°F), ranging from 29°C (84°F) in February to 23°C (73°F) in July.
Rainfall is high, totalling around 2776 mm (109 in) per year. January is the wettest month and August the driest. The city also experiences a distinct rainy season from October to April. The most sunshine falls in July, with an average of 3.7 hours of daily sunshine.
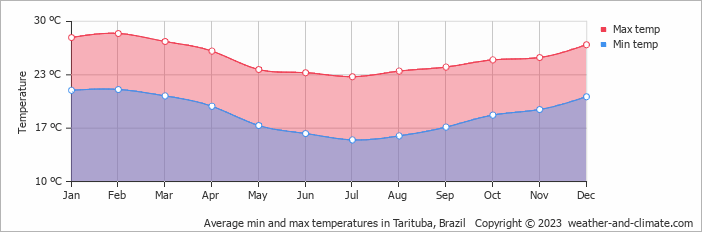
Monthly Temperature in Tarituba
The climate in Tarituba remains fairly constant, offering comfortable temperatures throughout the year. Average maximum daytime temperatures range from a comfortable 29°C (84°F) in February, the warmest time of the year, to a comfortable 23°C (73°F) during cooler months like July.
At night, you can expect temperatures ranging from 22°C (72°F) in February to around 15°C (59°F) during July.
Check out our detailed temperature page for more information.
Temperature ranges by month
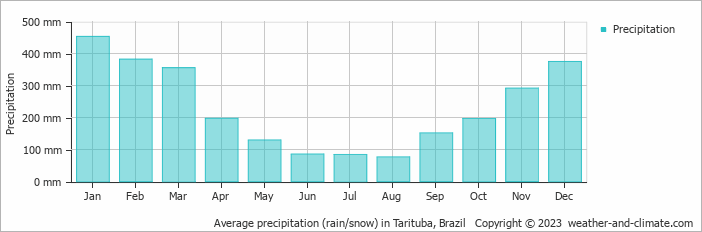
Rainfall in Tarituba
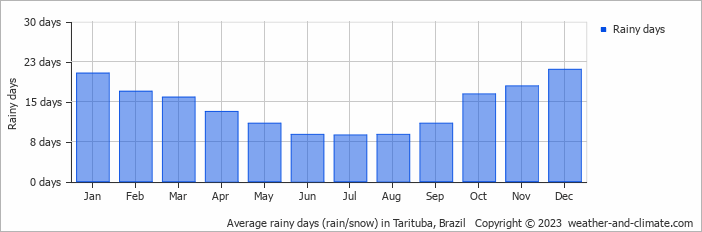
Tarituba is known for its substantial rainfall, with annual precipitation reaching 2776 mm (109 in). Significant seasonal changes in precipitation occur throughout the year. In the wettest month, January it receives heavy rainfall, averaging 453 mm (18 in) of precipitation, recorded across 20 rainy days. In contrast, the driest month August brings less rainfall, with 77 mm (3 in) over 9 rainy days. For more details, please visit our Tarituba Precipitation page.
The mean monthly precipitation over the year, including rain, hail, and snow
The average number of days each month with precipitation
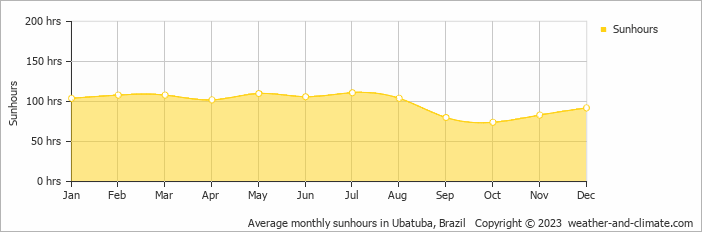
Sunshine Hours in Tarituba
While the amount of sunshine in Tarituba varies throughout the year, all seasons offer their own charm. Enjoy up to 3.7 hours of daily sun in July, and experience slightly darker atmosphere in October, with about 2.5 hours of daily sunlight.
Visit our detailed sunshine hours page for more information.
Monthly hours of sunshine
Daily hours of sunshine
Tarituba 3-Day Forecast
Check the conditions for any month of the year.
Best Time to Visit Tarituba
During May, June, July and August, Tarituba experiences its most favorable weather, with temperatures between 23°C (74°F) and 24°C (75°F). These mild conditions make it an excellent time for a visit.The weather does bring rainfall during this period, between 77 mm (3 in) and 129 mm (5.1 in).
Plan accordingly for January, February, March, April, October, November and December, when conditions bring the heaviest precipitation. Need help choosing your next travel destination? We offer a specialized tool that matches you with locations based on your weather preferences. Explore destinations that suit your climate preferences.