Tapachula Weather & Climate: Best Time to Visit
Average temperatures, rainfall, sunshine and the best time to visit Tapachula.
Climate overview of Tapachula
Tapachula, Chiapas, Mexico, has a stable climate with little temperature variation across the year. Average daytime temperatures hover around 31°C (88°F), peaking in April at 33°C (91°F) and dipping in October to 30°C (86°F).
The city has a wet climate, receiving around 2819 mm (111 in) of rainfall per year. Despite the high annual total, it has distinct dry (December to March) and wet (May to November) seasons. September is the wettest month. The most sunshine falls in January, with an average of 7.7 hours of daily sunshine.
Tapachula Weather by Month
Pick a month to see the average temperature, rainfall and sunshine in Tapachula - and find the best time to visit.
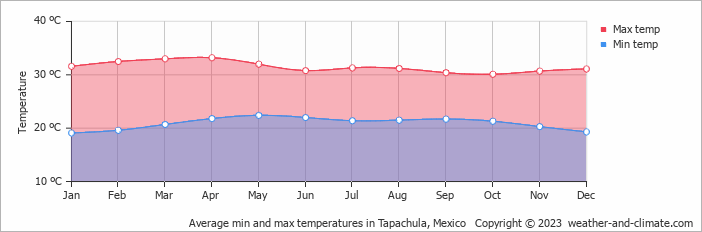
Monthly Temperature in Tapachula
With minimal seasonal shifts, Tapachula experiences a constant climate year-round. On average, daytime temperatures range from a very warm 33°C (91°F) in April to a very warm 30°C (86°F) in October.
Nighttime temperatures range from 22°C (72°F) in April to 19°C (66°F) in October.
Check out our detailed temperature page for more information.
Temperature ranges by month
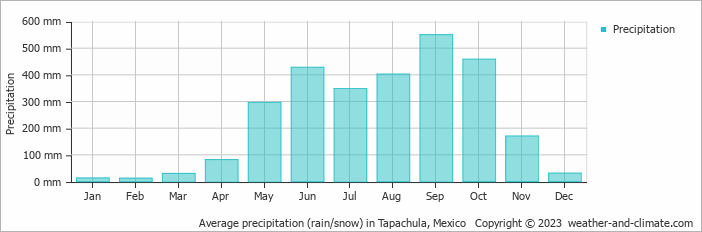
Rainfall in Tapachula
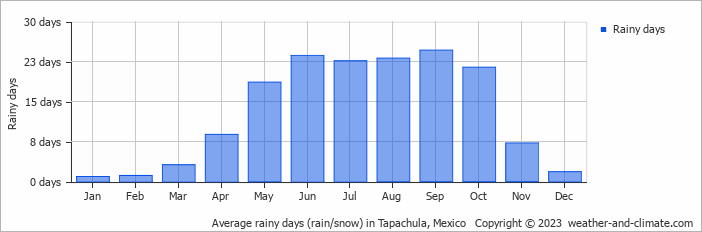
Tapachula has a notably wet climate with abundant precipitation, recording 2819 mm (111 in) of rainfall per year. The seasons in Tapachula bring significant changes in precipitation. The wettest month, September, receives heavy rainfall, with an average of 550 mm (22 in) of precipitation. This rainfall is distributed across 25 rainy days.
In contrast, the driest month, February, experiences much less rainfall, totaling 12 mm (0.5 in) over a single rainy day. These distinct seasonal differences provide diverse experiences throughout the year. For more details, please visit our Tapachula Precipitation page.
The mean monthly precipitation over the year, including rain, hail, and snow
The average number of days each month with precipitation
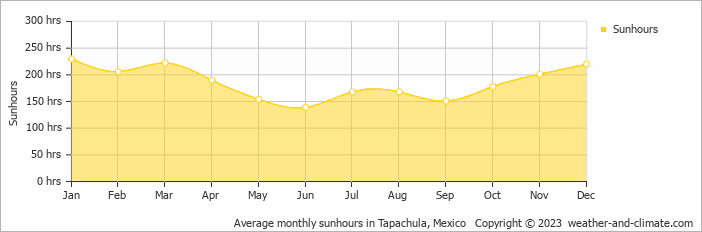
Sunshine Hours in Tapachula
In Tapachula, summer days are longer and more sunny, with daily sunshine hours peaking at 7.7 hours in January. As the darker season arrives, the brightness of the sun becomes less. June sees a soft sun for only 4.6 hours per average day.
Visit our detailed sunshine hours page for more information.
Monthly hours of sunshine
Daily hours of sunshine
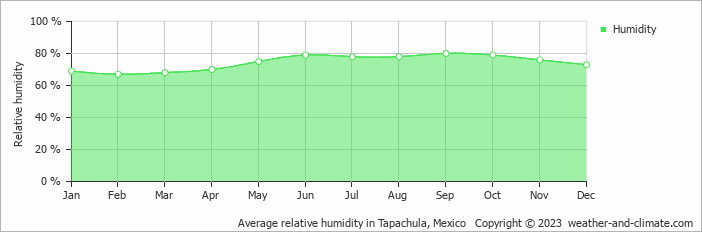
Humidity in Tapachula by Month
The relative humidity is high throughout the year in Tapachula.
The city experiences its highest humidity in September, reaching 80%. In February, the humidity drops to its lowest level at 67%. What does this mean? Read our detailed page on humidity levels for further details.
Relative humidity over the year
Best Time to Visit Tapachula
Monthly ratings reflect general weather comfort, based on daytime temperature and rainfall. Swimming and winter conditions are highlighted separately where relevant.
- Best overall: January
- Warmest weather: February, March, April and May
- Most sunshine: January, March and December
- Fewest rainy days: January, February and December
- Wettest months: May, June, July, August, September and October, when rainfall is highest.
- Seasonal pattern: Distinct dry (December to March) and wet (May to November) seasons
Frequently asked questions about the climate in Tapachula
What is the best time to visit Tapachula?
January typically offers the most optimal weather in Tapachula. In contrast, May, June, July, August, September and October tend to have less optimal conditions. Tapachula has distinct dry (December to March) and wet (May to November) seasons.
What temperatures can I expect in Tapachula?
Daytime highs range from 30°C (86°F) in October to 33°C (91°F) in April. Nighttime lows range from 19°C (66°F) to 22°C (72°F). Temperatures stay relatively stable year-round.
How much rain does Tapachula get?
Annual rainfall is around 2819 mm (111 in). September is the wettest month with 550 mm (22 in), while February is the driest with 12 mm (0.5 in).
How sunny is Tapachula?
Tapachula receives around 2,227 hours of sunshine per year. January is the sunniest month with 230 hours, while June is the cloudiest with just 139 hours. Overall, Tapachula enjoys abundant sunshine.
Tapachula 3-Day Forecast
Tapachula on the map
Tapachula is highlighted - select any city to see its climate.
Popular this month
Where to go in July - average daytime high across popular destinations.
Bucket list
Need travel inspiration? Check out our bucket list articles and be inspired.
 Explore the Majestic Copper Canyons of Mexico
Explore the vast Copper Canyons in Chihuahua, Mexico—larger than the Grand Canyon. Discover scenic train rides, hikes, and the Tarahumara people.
These are the most beautiful Mayan ruins and Mayan temples in Mexico
Mexico is a destination where you can immerse yourself in ancient cultures and civilizations. In this article we have listed our favorite Mayan ruins.
Tips, to-do's and nicest restaurants in Mexico City
Mexico City, one of the most famous and notorious cities of the world. The best time to visit is between March and May, but it can be visited year round.
Zihuatanejo: A Pacific paradise with beautiful beaches
Zihuatanejo has some of Mexico's top beaches. Unlike other off-the-beaten-path destinations in Mexico, Zihua is very accessible and sustainable.