Tapachula Sunshine Hours by Month
To truly understand a climate, we must look at its sunshine. This page shows the total number of hours of direct sunlight per month and the average hours per day in Tapachula, Chiapas, Mexico. The figures are based on a 30-year period (1990–2020) to provide a reliable average.
Monthly hours of sunshine
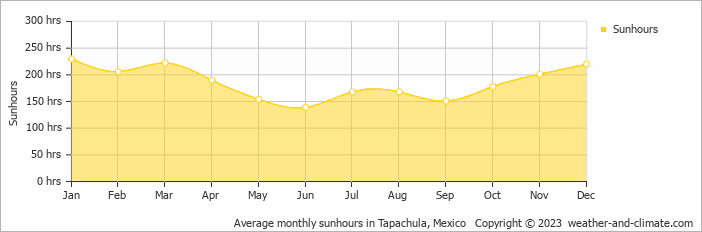
Seasonal sunshine in Tapachula varies. It peaks at 230 hours in January and drops to 139 hours in June. The total annual amount of sun is 2227 hours.
Daily hours of sunshine
This means the city can be enjoyed more throughout the sunniest month of January under a blue sky, with approximately 7.7 hours of sunshine daily. In contrast, the city experiences much darker days in June, with only 4.6 hours of sunlight per day.
Tapachula vs Major Cities: Sunshine Compared
Tapachula enjoys an average of 2227 hours of sunshine annually. Let’s compare this with some popular tourist destinations:
The city of Rome, Italy, experiences 2470 hours of sunshine annually, adding to its charm as a year-round tourist destination.
In contrast, Brussels, Belgium, receives only about 1590 hours of sunshine per year, known for its frequently overcast and rainy skies.
Boston, USA, enjoys 2629 hours of sunshine annually, with distinct seasons and many bright, sunny days.
Adelaide, Australia, enjoys 2770 hours of sunshine annually, with long, sunny summers.
Related Climate Data for Tapachula
September, Tapachula’s wettest month, receives 81 mm (3.2 in) of rainfall and has a maximum daytime temperature of 30°C (86°F). During the driest month February you can expect a temperature of 33°C (91°F).
For more detailed insights into the city’s temperatures, check out our Temperature page. To explore more about precipitation patterns, visit our Tapachula Precipitation page.


