Taíba Weather & Climate: Best Time to Visit
Taíba, Ceará, Brazil, enjoys a steady climate throughout the year, with daytime temperatures typically around 30°C (86°F). August is the warmest month at 30°C (86°F), while July is the coolest at 30°C (86°F).
The city receives considerable rainfall, with around 1220 mm (48 in) annually. April is the wettest month. It has distinct dry (August to November) and wet (February to April) seasons. The sunniest month is October, with 9.9 hours of sunshine per day on average.
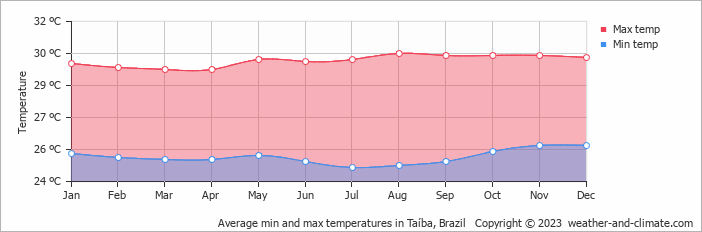
Monthly Temperature in Taíba
The temperature in Taíba remains steady throughout the year, providing a consistently very warm climate. Typically, average maximum daytime temperatures range from a very warm 30°C (86°F) in August to a comfortable 30°C (86°F) in the coolest month, July.
Nights vary from 26°C (79°F) in August to around 25°C (77°F) during the colder months.
Check out our detailed temperature page for more information.
Temperature ranges by month
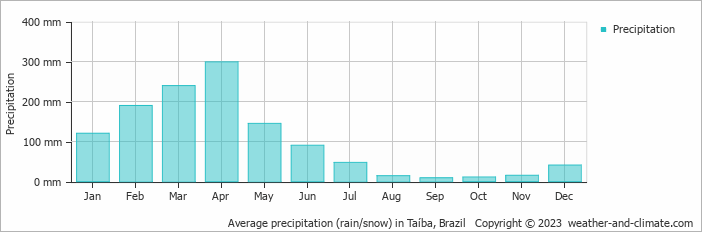
Rainfall in Taíba
Taíba has a relatively rainy climate with high precipitation levels, averaging 1220 mm (48 in) of rainfall annually. The climate in Taíba shows significant variation throughout the year. Expect heavy rainfall in April, the wettest month, with an average of 299 mm (12 in) of precipitation over 29 rainy days.
In contrast, the driest month September offers drier and sunnier days, with around 8.8 mm (0.3 in) of rainfall over 13 rainy days. For more details, please visit our Taíba Precipitation page.
The mean monthly precipitation over the year, including rain, hail, and snow
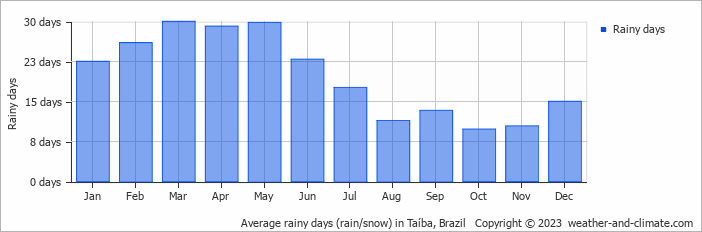
The average number of days each month with precipitation
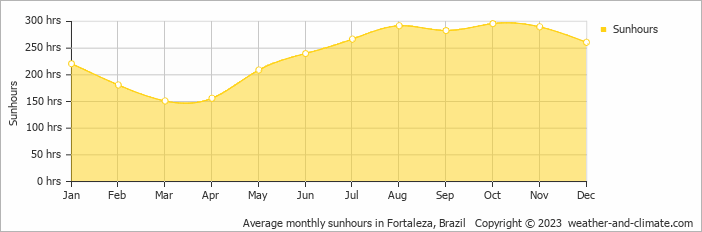
Sunshine Hours in Taíba
For those who appreciate different seasons, Taíba serves as an ideal destination. Expect longer, more sun-filled days in October with an average of 9.9 hours of sunshine daily, and embrace the darker days in March, offering only 5.0 hours of daily sunlight.
Visit our detailed sunshine hours page for more information.
Monthly hours of sunshine
Daily hours of sunshine
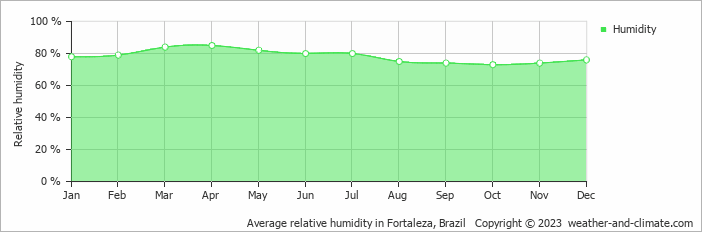
Humidity in Taíba by Month
The relative humidity is high throughout the year in Taíba.
The city experiences its highest humidity in April, reaching 85%. In October, the humidity drops to its lowest level at 73%. What does this mean? Read our detailed page on humidity levels for further details.
Relative humidity over the year
Taíba 3-Day Forecast
Check the conditions for any month of the year.
Best Time to Visit Taíba
Taíba has warm weather with temperatures ranging from 30°C (86°F) to 30°C (86°F) throughout the year. The best time to visit is during July, August, September, October, November and December, when rainfall is at its lowest, making it a great time for sightseeing and exploring all the place has to offer.For a more comfortable experience, start your day early when the weather is cooler, or take advantage of the gentle breezes in the late afternoon.
The rainy season occurs during February, March and April, when the area experiences its heaviest rainfall. Planning your next adventure but unsure where to go? Our climate tool suggests perfect locations tailored to your preferred weather conditions. Discover your ideal travel destination with our weather planner.