Tababela Weather & Climate: Best Time to Visit
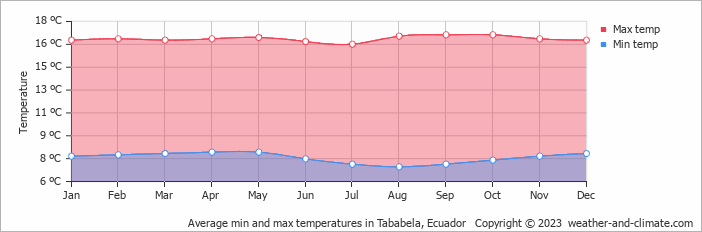
The climate in Tababela, Ecuador, is remarkably consistent, with temperatures year-round averaging 17°C (63°F). The warmest month is September at 17°C (63°F), and the coolest is August at 16°C (61°F).
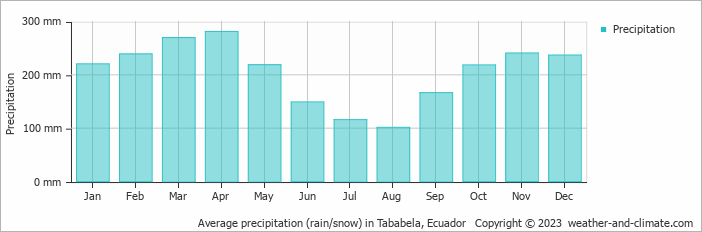
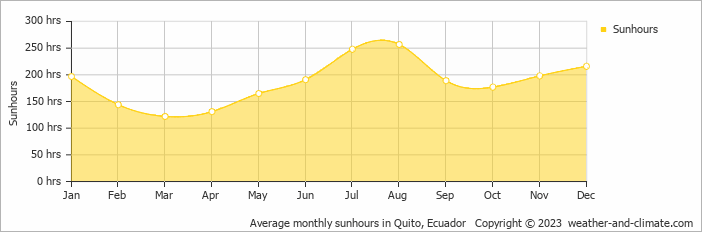
The city has a wet climate, receiving around 2456 mm (97 in) of rainfall per year. Despite the high annual total, it has a distinct rainy season from October to May. April is the wettest month. August is the sunniest month, averaging 8.6 hours of sunshine per day.
Monthly Temperature in Tababela
In Tababela temperatures are generally consistent throughout the year. On average, daytime temperatures range from a moderate 17°C (63°F) in September to a moderate 16°C (61°F) in August.
Nighttime temperatures range from 8°C (46°F) in September to 7°C (45°F) in August.
Check out our detailed temperature page for more information.
Temperature ranges by month
Rainfall in Tababela
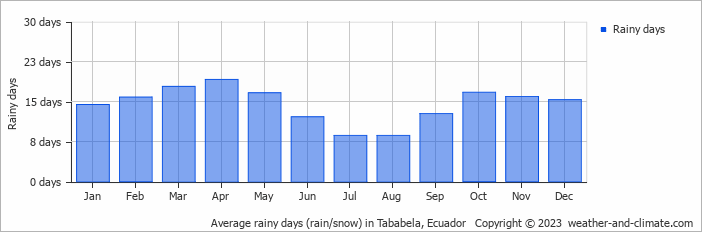
Tababela experiences significant rainfall throughout the year, averaging 2456 mm (97 in) of precipitation annually. The seasons in Tababela bring significant changes in precipitation. The wettest month, April, receives heavy rainfall, with an average of 281 mm (11 in) of precipitation. This rainfall is distributed across 19 rainy days.
In contrast, the driest month, August, experiences much less rainfall, totaling 101 mm (4 in) over 9 rainy days. These distinct seasonal differences provide diverse experiences throughout the year. For more details, please visit our Tababela Precipitation page.
The mean monthly precipitation over the year, including rain, hail, and snow
The average number of days each month with precipitation
Sunshine Hours in Tababela
In Tababela, summer days are longer and more sunny, with daily sunshine hours peaking at 8.6 hours in August. As the darker season arrives, the brightness of the sun becomes less. March sees a soft sun for only 4.1 hours per average day.
Visit our detailed sunshine hours page for more information.
Monthly hours of sunshine
Daily hours of sunshine
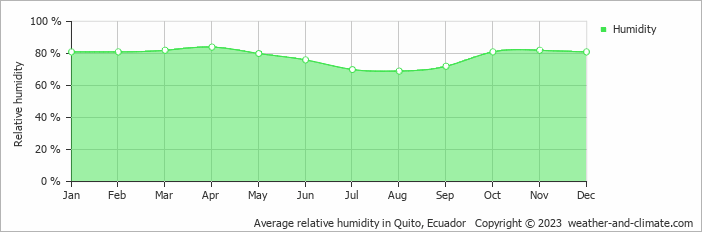
Humidity in Tababela by Month
The relative humidity is high throughout the year in Tababela.
The city experiences its highest humidity in April, reaching 84%. In August, the humidity drops to its lowest level at 69%. What does this mean? Read our detailed page on humidity levels for further details.
Relative humidity over the year
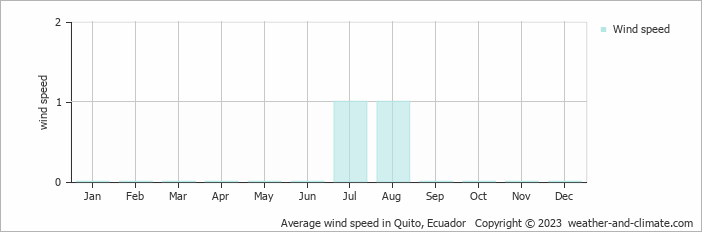
Wind Speed in Tababela
The mean wind speed varies between () and 1 m/s (2 knots) throughout the year. It is lowest in January, February, March, April, May, June, September, October, November and December and highest during July and August. What does this mean?
The mean monthly wind speed over the year (meters per second)
Tababela 3-Day Forecast
Check the conditions for any month of the year.


