Quito Weather & Climate: Best Time to Visit
Because of its altitude and location on the equator, Quito has a fairly constant cool climate. The weather in the city is characterized by a constant temperature year-round. From June till September you will experience less rain, more sunshine and less humidity. This makes this period the perfect time to travel to Quito.
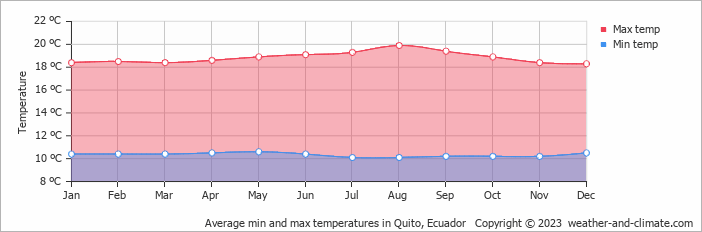
Monthly Temperature in Quito
The climate in Quito remains fairly constant, offering pleasant temperatures throughout the year. Average maximum daytime temperatures range from a pleasant 20°C (68°F) in August, the warmest time of the year, to a pleasant 18°C (64°F) during cooler months like July.
At night, you can expect temperatures ranging from 11°C (52°F) in August to around 10°C (50°F) during July.
Check out our detailed temperature page for more information.
Temperature ranges by month
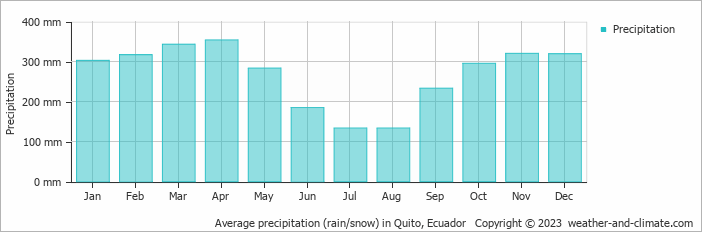
Rainfall in Quito
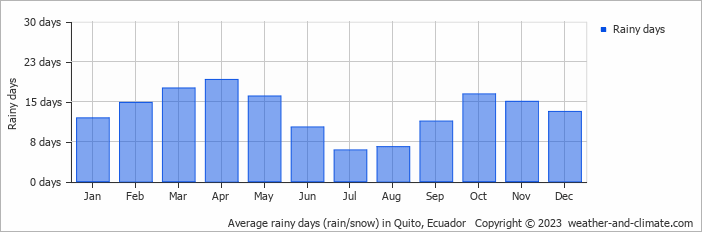
Quito is known for its substantial rainfall, with annual precipitation reaching 3216 mm (127 in). Significant seasonal changes in precipitation occur throughout the year. In the wettest month, April it receives heavy rainfall, averaging 354 mm (14 in) of precipitation, recorded across 19 rainy days. In contrast, the driest month July brings less rainfall, with 133 mm (5.2 in) over 6 rainy days. For more details, please visit our Quito Precipitation page.
The mean monthly precipitation over the year, including rain, hail, and snow
The average number of days each month with precipitation
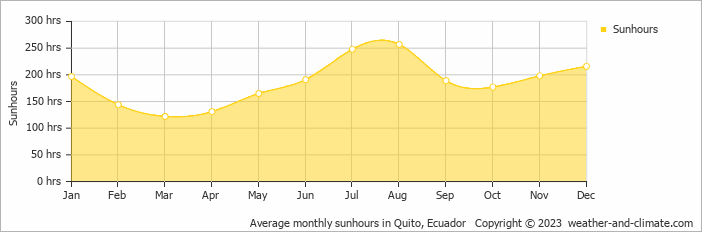
Sunshine Hours in Quito
Seasonal changes in sunshine hours are quite dramatic in Quito. While August receives considerable daily sunshine with up to 8.6 hours, March marks the darkest time of the year, where sunshine is scarce with only 4.1 hours of sunlight per day.
Visit our detailed sunshine hours page for more information.
Monthly hours of sunshine
Daily hours of sunshine
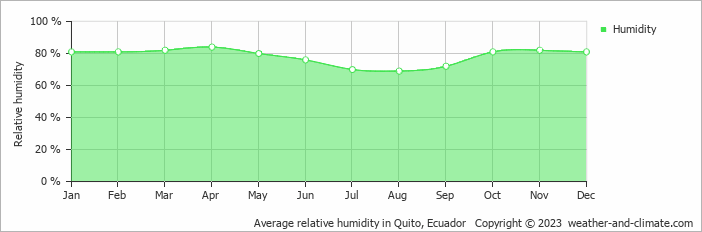
Humidity in Quito by Month
The relative humidity is high throughout the year in Quito.
The city experiences its highest humidity in April, reaching 84%. In August, the humidity drops to its lowest level at 69%. What does this mean? Read our detailed page on humidity levels for further details.
Relative humidity over the year
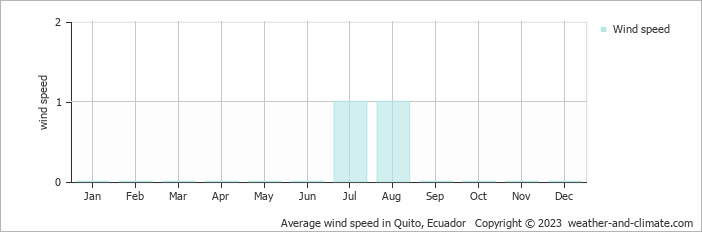
Wind Speed in Quito
The average wind speed over the year ranges from () to 1 m/s (2 knots). It is lower in January, February, March, April, May, June, September, October, November and December and higher in July and August. What does this mean?
The mean monthly wind speed over the year (meters per second)
Quito 3-Day Forecast
Check the conditions for any month of the year.
Best Time to Visit Quito
During July and August, Quito experiences its most favorable weather, with temperatures between 19°C (67°F) and 20°C (68°F). These mild conditions make it an excellent time for a visit.The weather brings rainfall of around 133 mm (5.2 in) during this period. Seeking the perfect travel destination for this year? We've created a tool that suggests locations matching your desired weather. Let our weather planner guide your travel decisions.


