Svolvær Weather & Climate: Best Time to Visit
The climate in Svolvær, Nordland, Norway, is marked by large temperature swings across the seasons, ranging from 15°C (59°F) in August to 2°C (36°F) in February.
The city has a wet climate, receiving around 1388 mm (55 in) of rain/snowfall per year. October is the wettest month.
Monthly Temperature in Svolvær
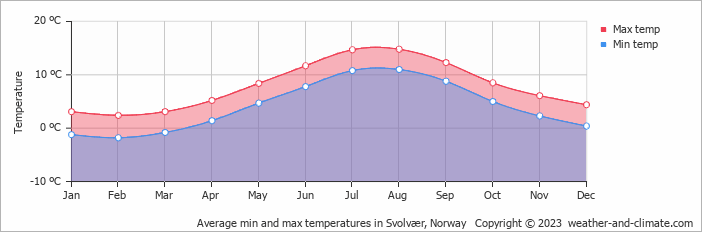
In Svolvær, temperatures differ significantly between summer and winter months. On average, daytime temperatures range from a moderate 15°C (59°F) in August to a chilly 2°C (36°F) in February.
Nighttime temperatures range from 11°C (52°F) in August to -2°C (28°F) in February.
Check out our detailed temperature page for more information.
Temperature ranges by month
Rainfall in Svolvær
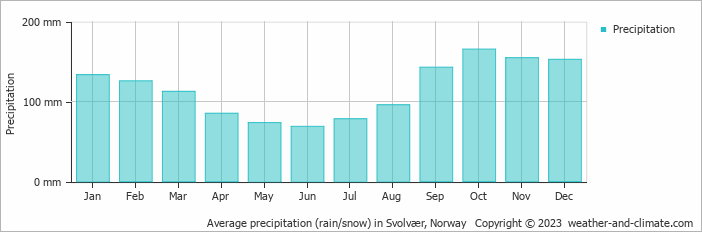
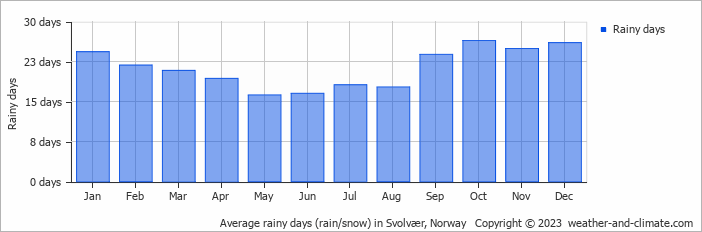
Svolvær experiences significant rain/snowfall throughout the year, averaging 1388 mm (55 in) of precipitation annually. The seasons in Svolvær bring significant changes in precipitation. The wettest month, October, receives heavy rainfall, with an average of 165 mm (6.5 in) of precipitation. This rainfall is distributed across 26 rainy days.
In contrast, the driest month, June, experiences much less rainfall, totaling 69 mm (2.7 in) over 17 rainy days. These distinct seasonal differences provide diverse experiences throughout the year. For more details, please visit our Svolvær Precipitation page.
The mean monthly precipitation over the year, including rain, hail, and snow
The average number of days each month with precipitation
Svolvær 3-Day Forecast
Check the conditions for any month of the year.
Best Time to Visit Svolvær
Weather patterns in Svolvær vary throughout the year, offering different conditions for visitors depending on the season. Each time of year brings its own unique weather characteristics. If we needed to point out one good month to visit, it would be June, the driest month with 69 mm (2.7 in) of rainfall.Be aware that October typically brings the highest precipitation. Need help choosing your next travel destination? We offer a specialized tool that matches you with locations based on your weather preferences. Explore destinations that suit your climate preferences.